 7
7peptides
spectra
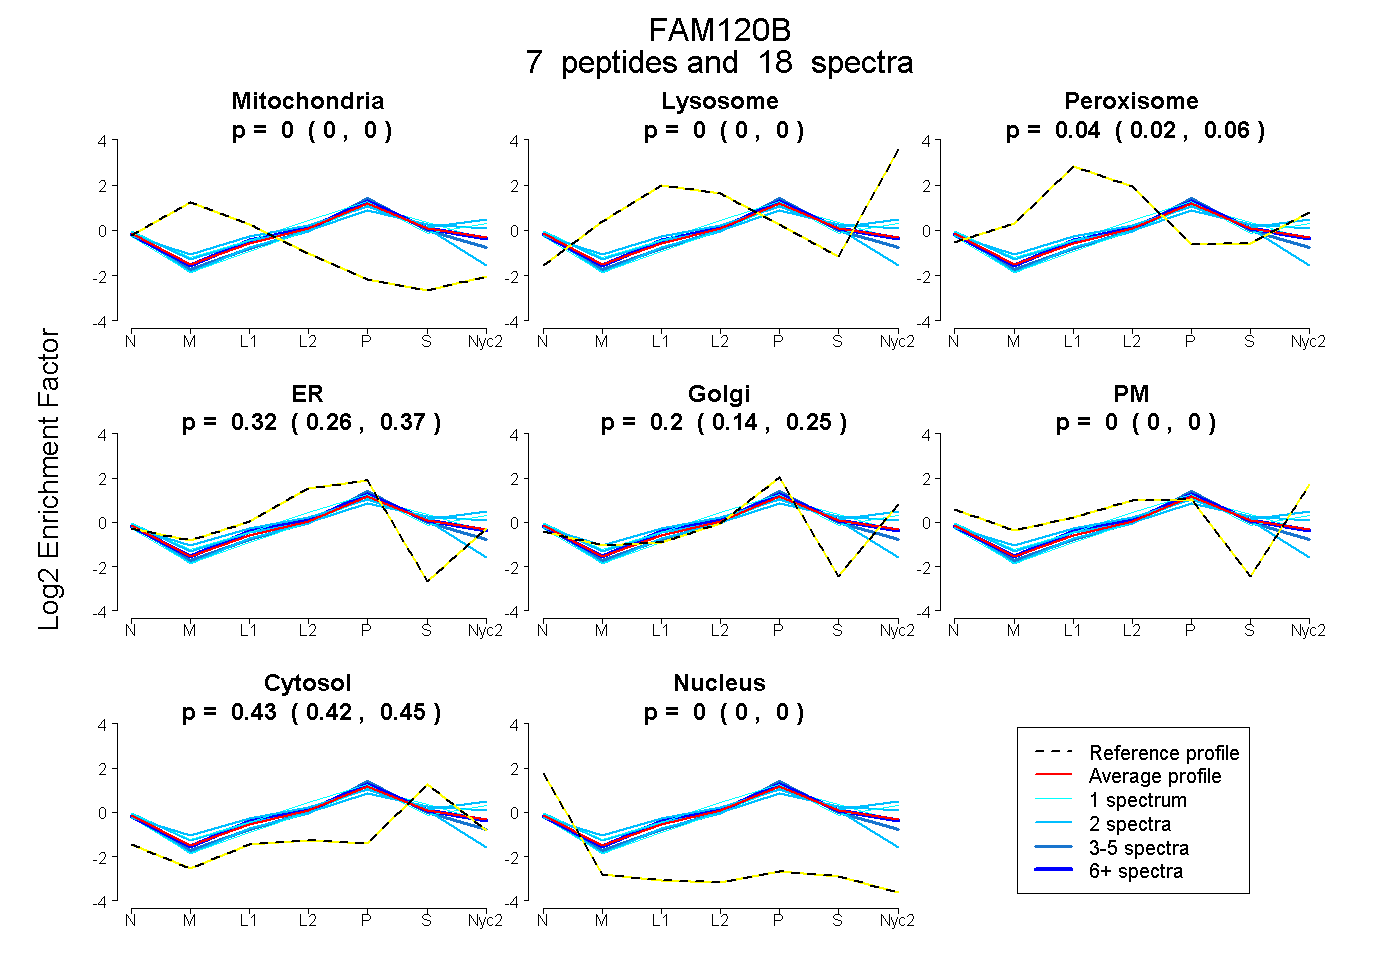
0.000 | 0.000
0.000 | 0.000
0.025 | 0.061
0.256 | 0.375
0.143 | 0.247
0.000 | 0.000
0.416 | 0.445
0.000 | 0.000
1peptide
spectrum
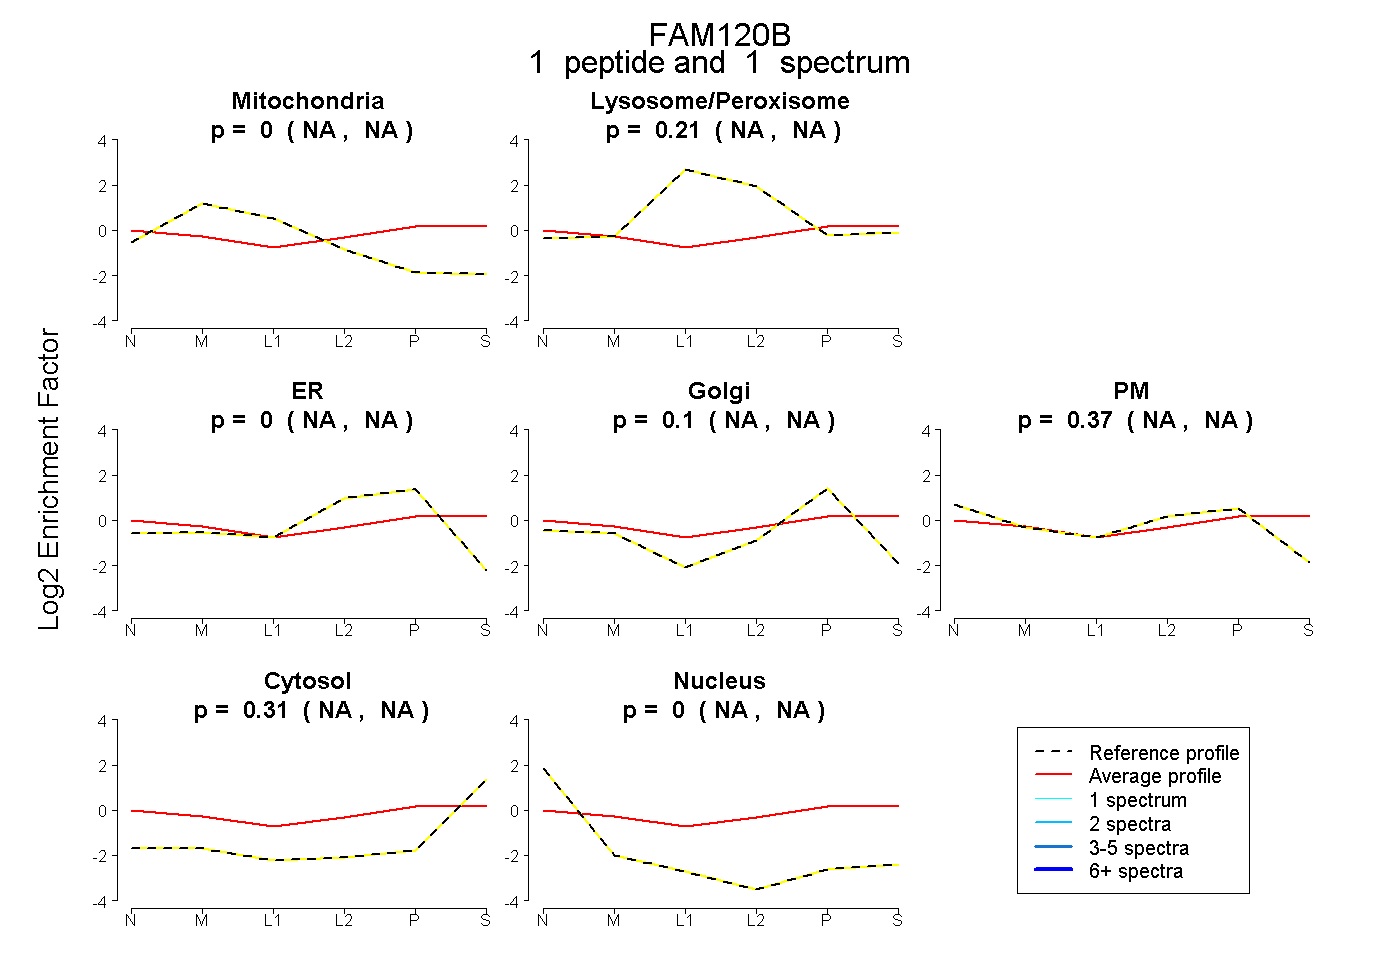
NA | NA
NA | NA
NA | NA
NA | NA
NA | NA
NA | NA
NA | NA
8peptides
spectra
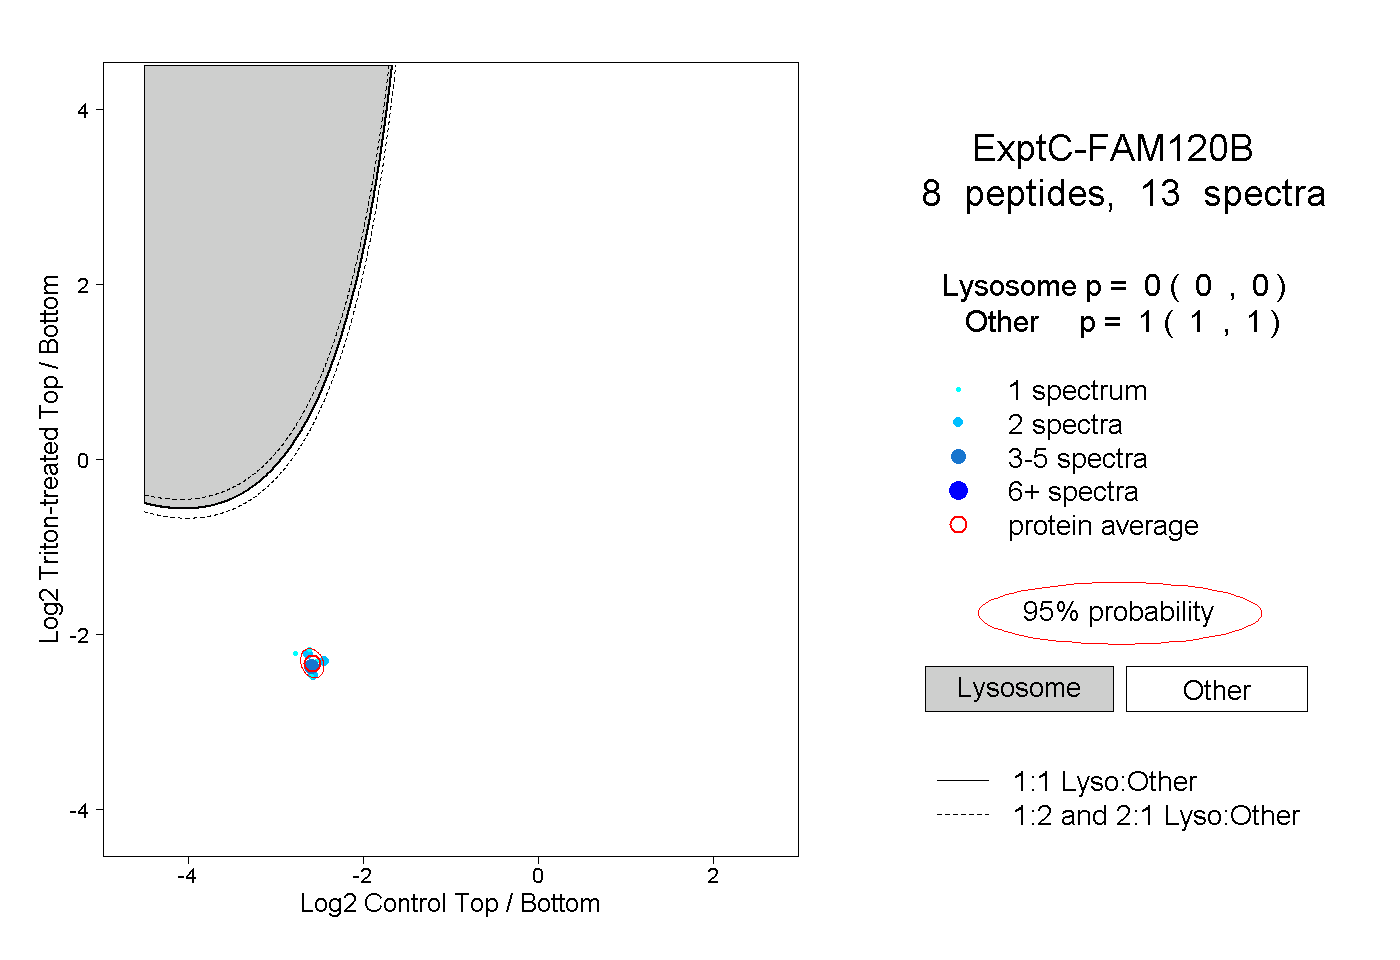
0.000 | 0.000
1.000 | 1.000
2peptides
spectra
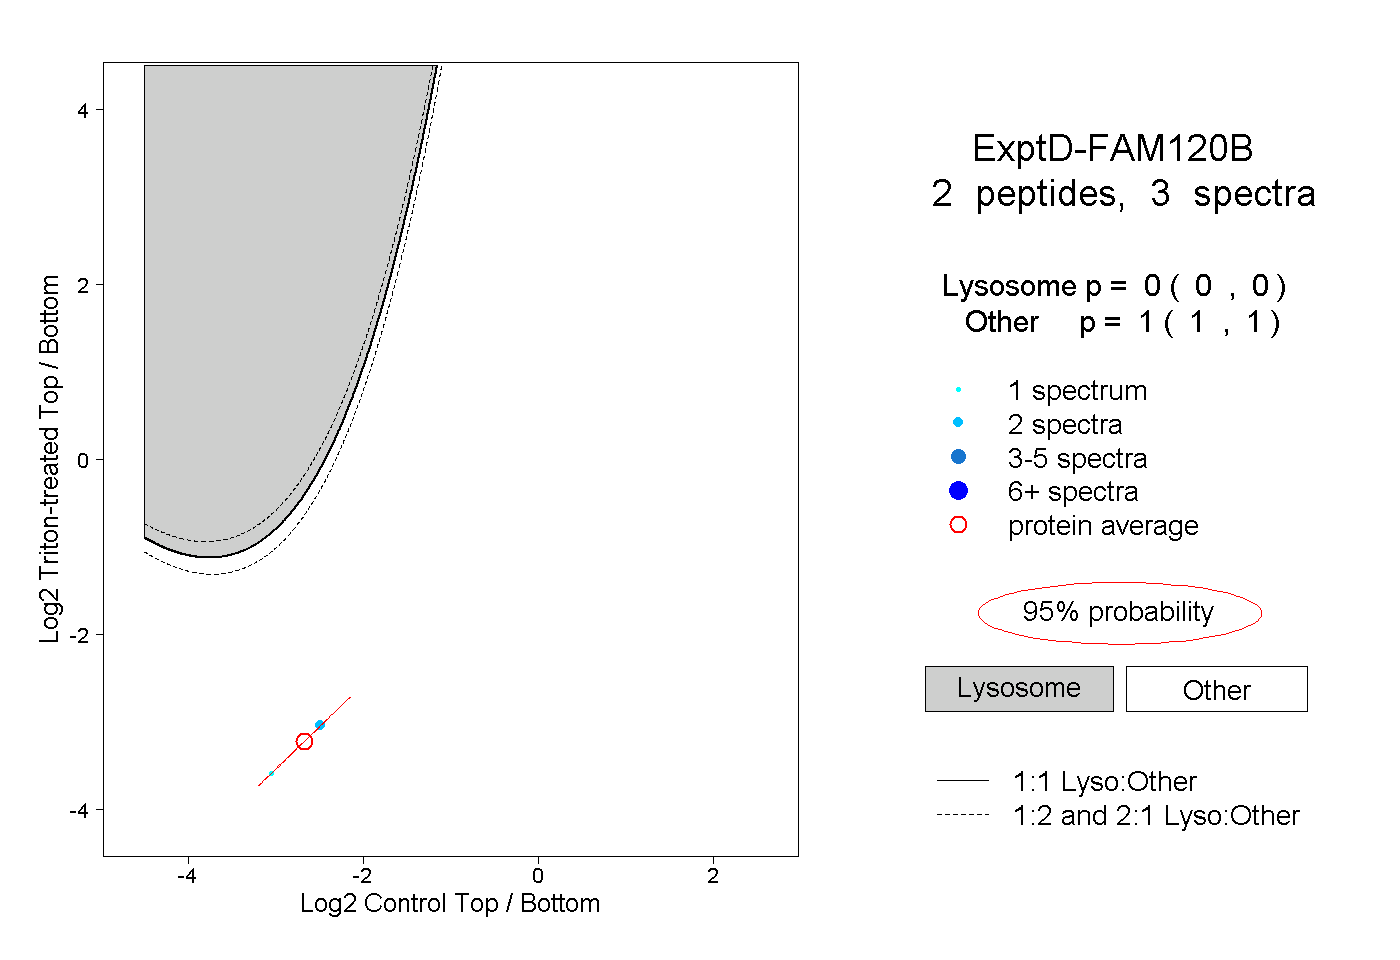
0.000 | 0.000
1.000 | 1.000