 15
15peptides
spectra
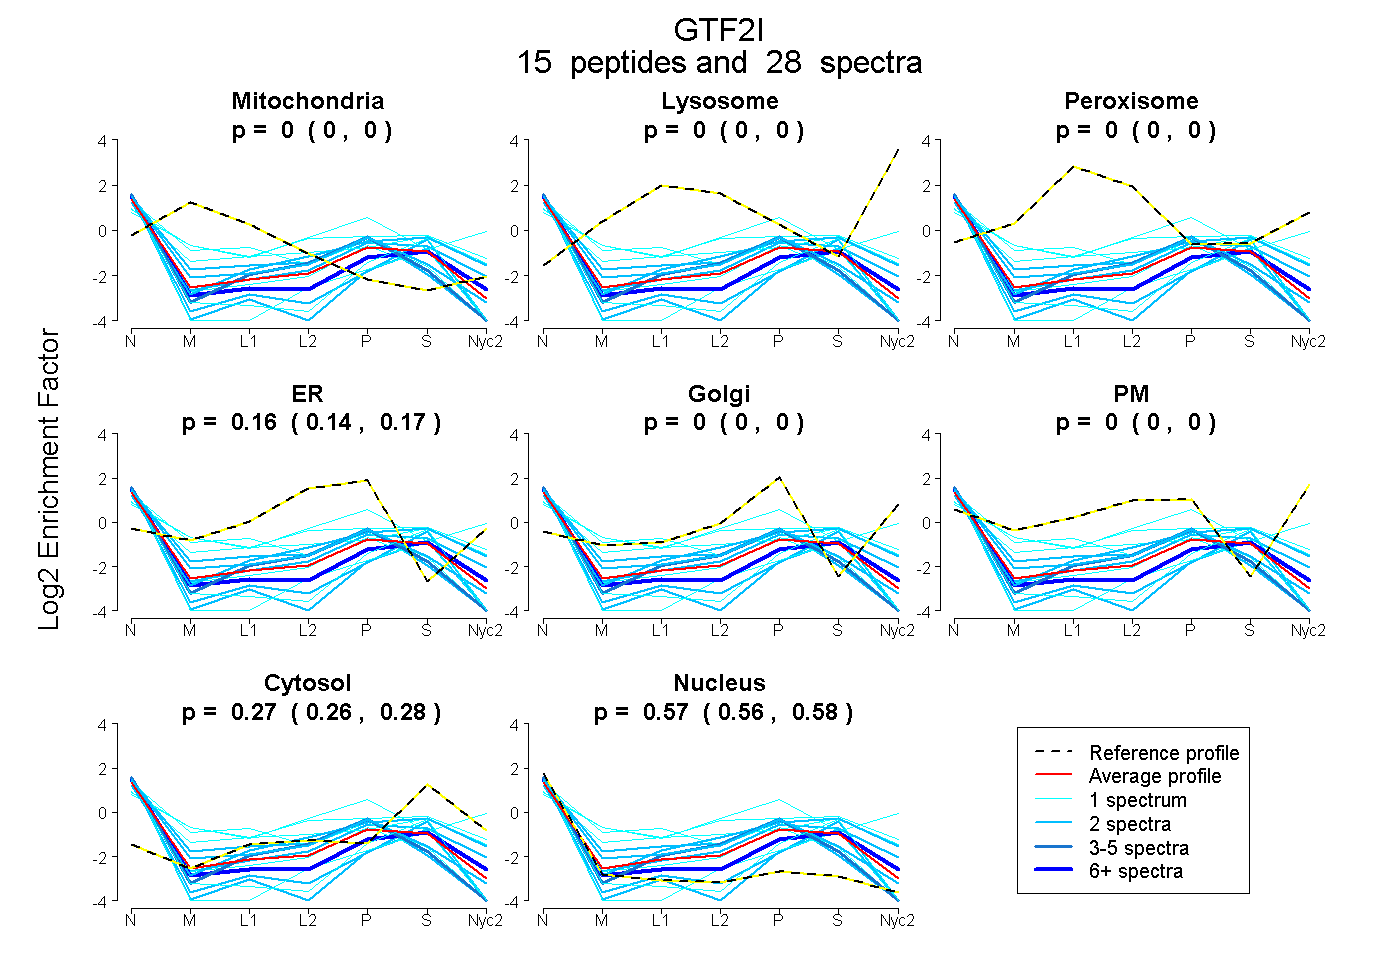
0.000 | 0.000
0.000 | 0.000
0.000 | 0.000
0.142 | 0.165
0.000 | 0.000
0.000 | 0.000
0.259 | 0.280
0.563 | 0.584
3peptides
spectra
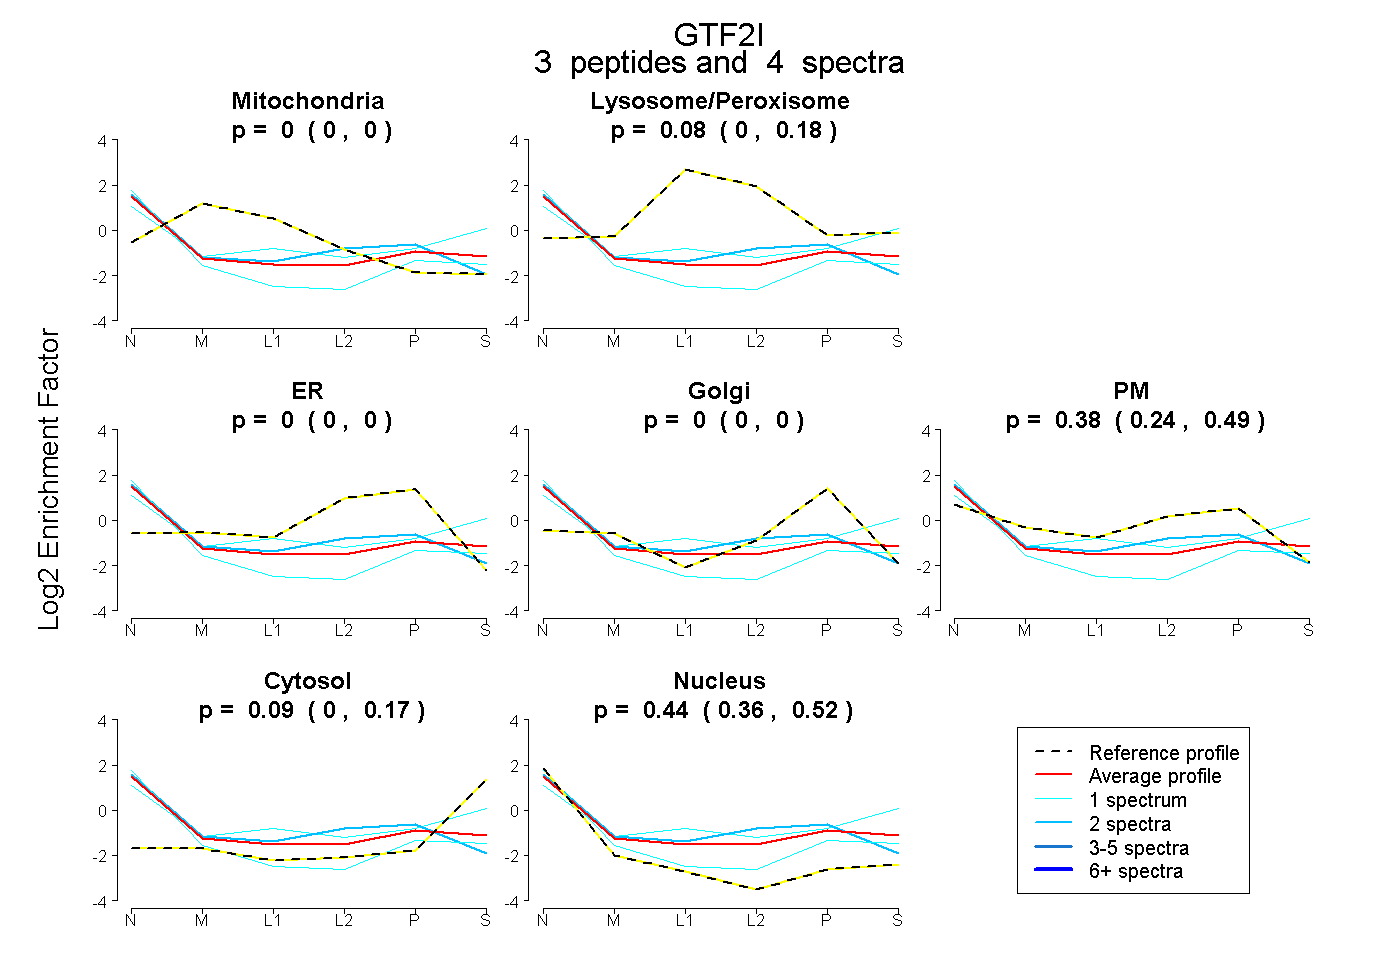
0.000 | 0.000
0.000 | 0.178
0.000 | 0.000
0.000 | 0.000
0.237 | 0.489
0.000 | 0.174
0.356 | 0.515
2peptides
spectra
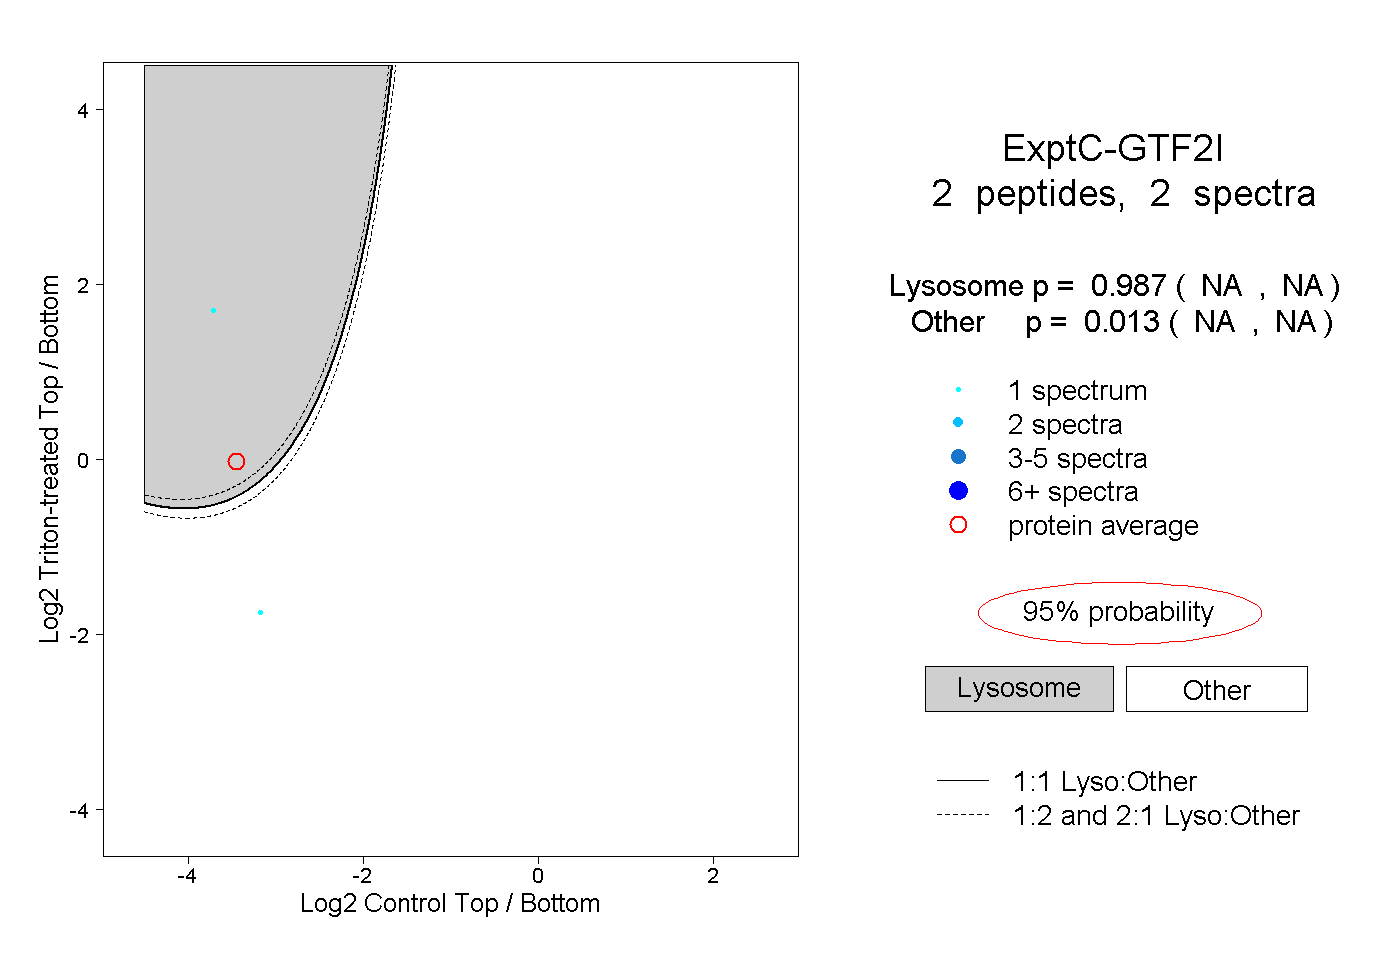
NA | NA
NA | NA