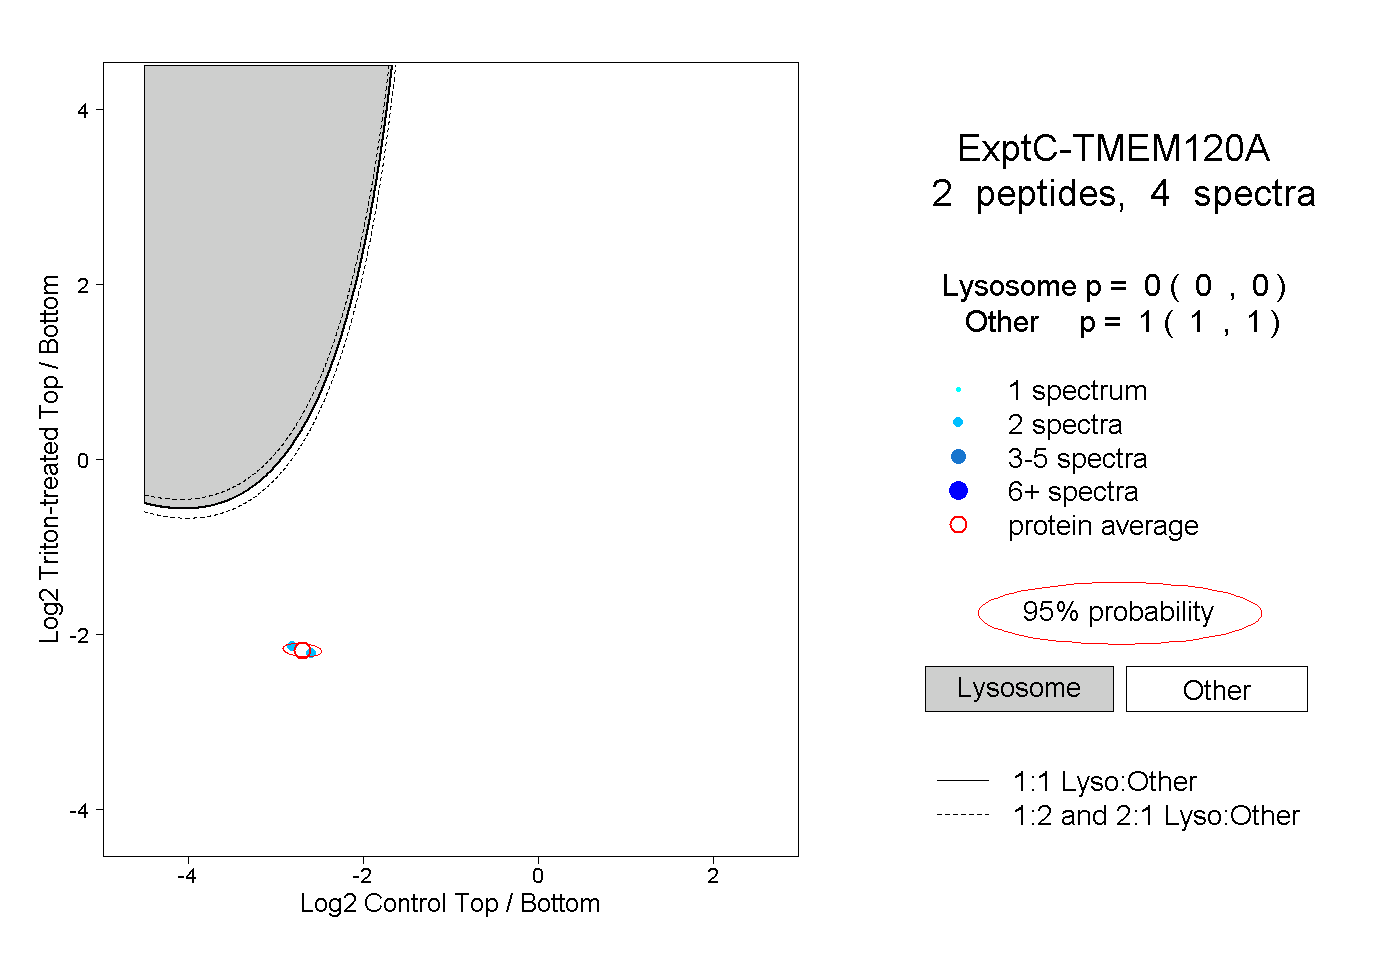
4
4peptides
spectra

0.000 | 0.000
0.000 | 0.000
0.000 | 0.000
0.897 | 0.949
0.000 | 0.000
0.000 | 0.000
0.000 | 0.000
0.046 | 0.099
3peptides
spectra
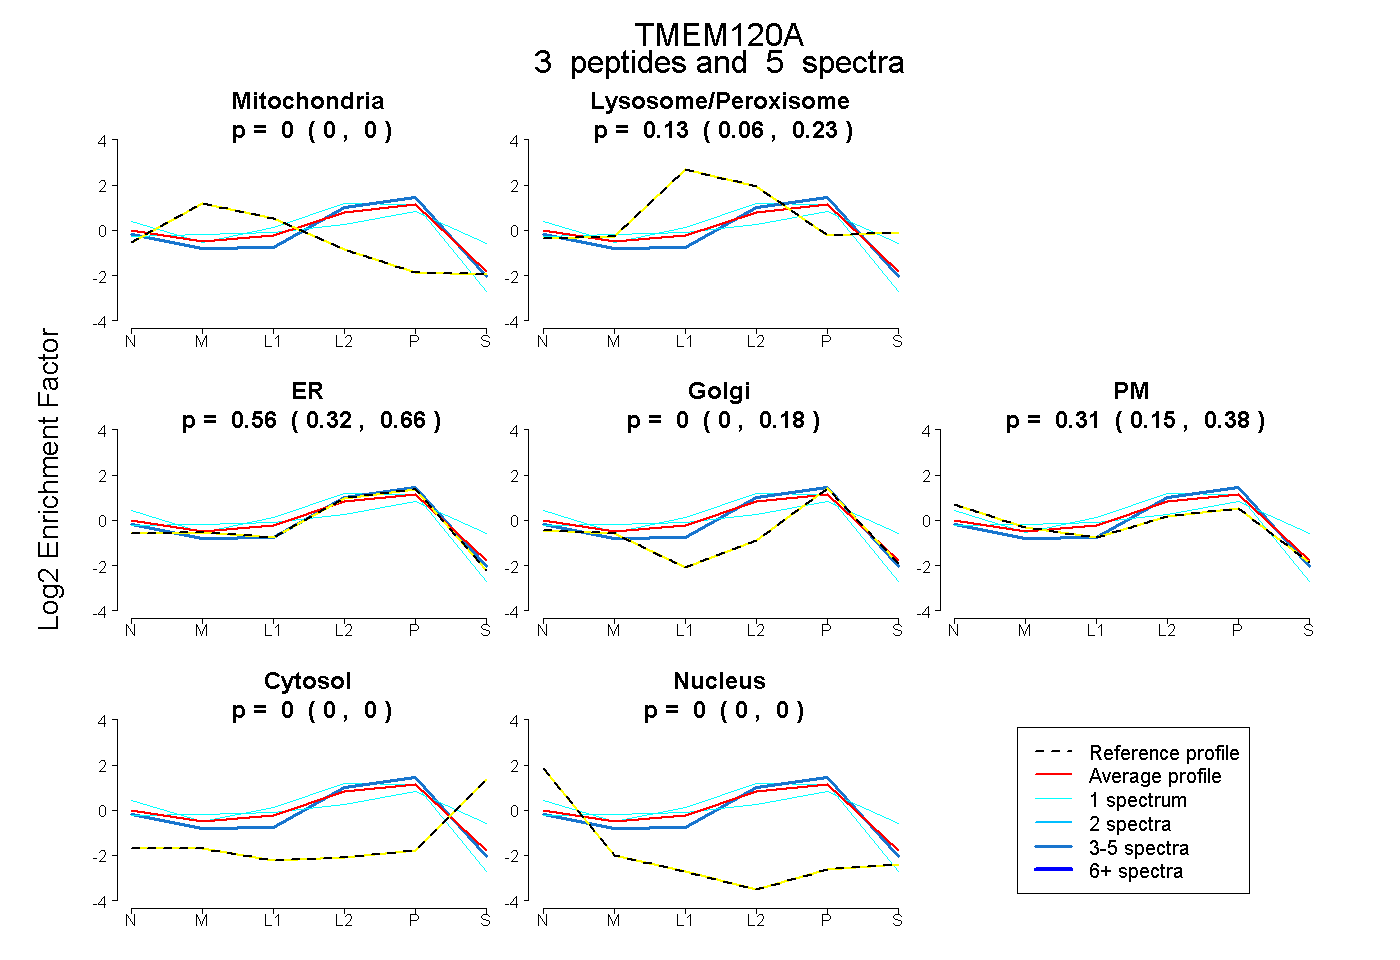
0.000 | 0.000
0.057 | 0.229
0.323 | 0.664
0.000 | 0.180
0.147 | 0.381
0.000 | 0.000
0.000 | 0.000