9
9peptides
spectra
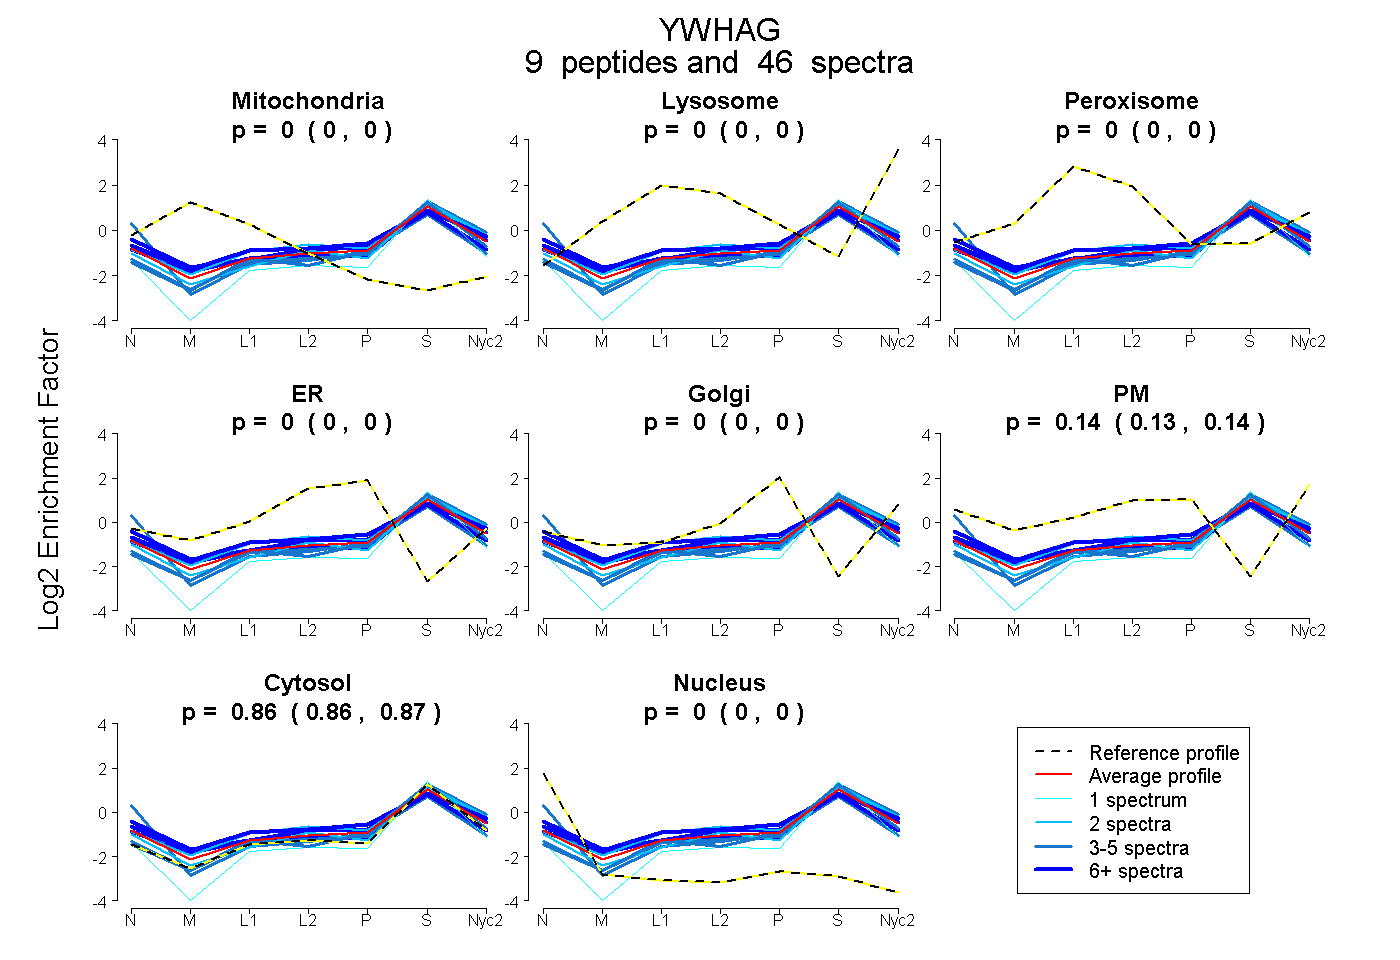
0.000 | 0.000
0.000 | 0.000
0.000 | 0.000
0.000 | 0.000
0.000 | 0.000
0.129 | 0.139
0.858 | 0.869
0.000 | 0.004
4peptides
spectra
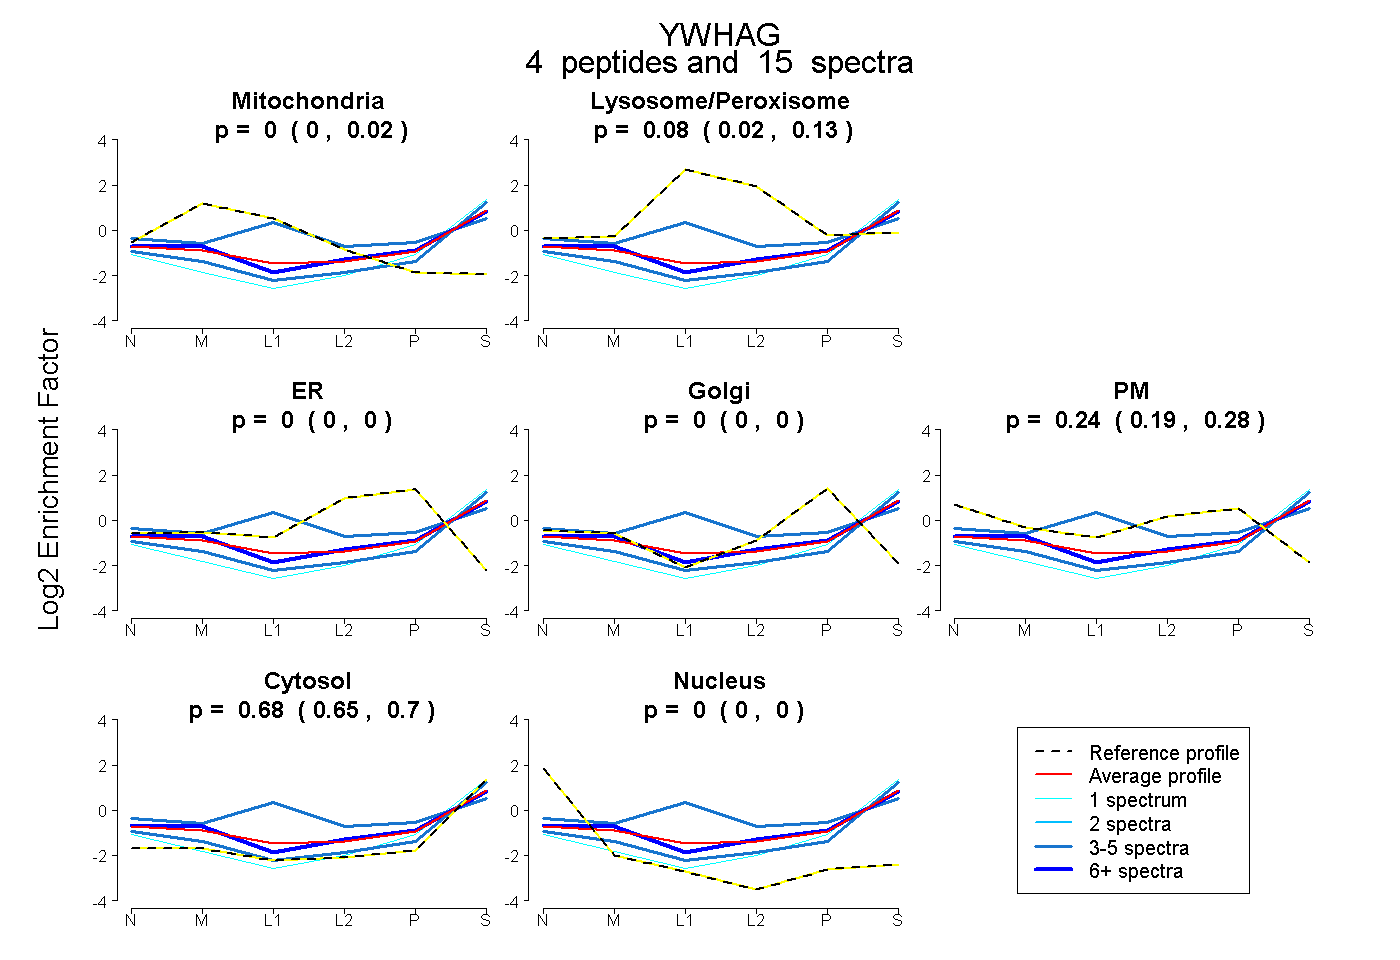
0.000 | 0.021
0.022 | 0.131
0.000 | 0.000
0.000 | 0.000
0.186 | 0.279
0.654 | 0.701
0.000 | 0.000
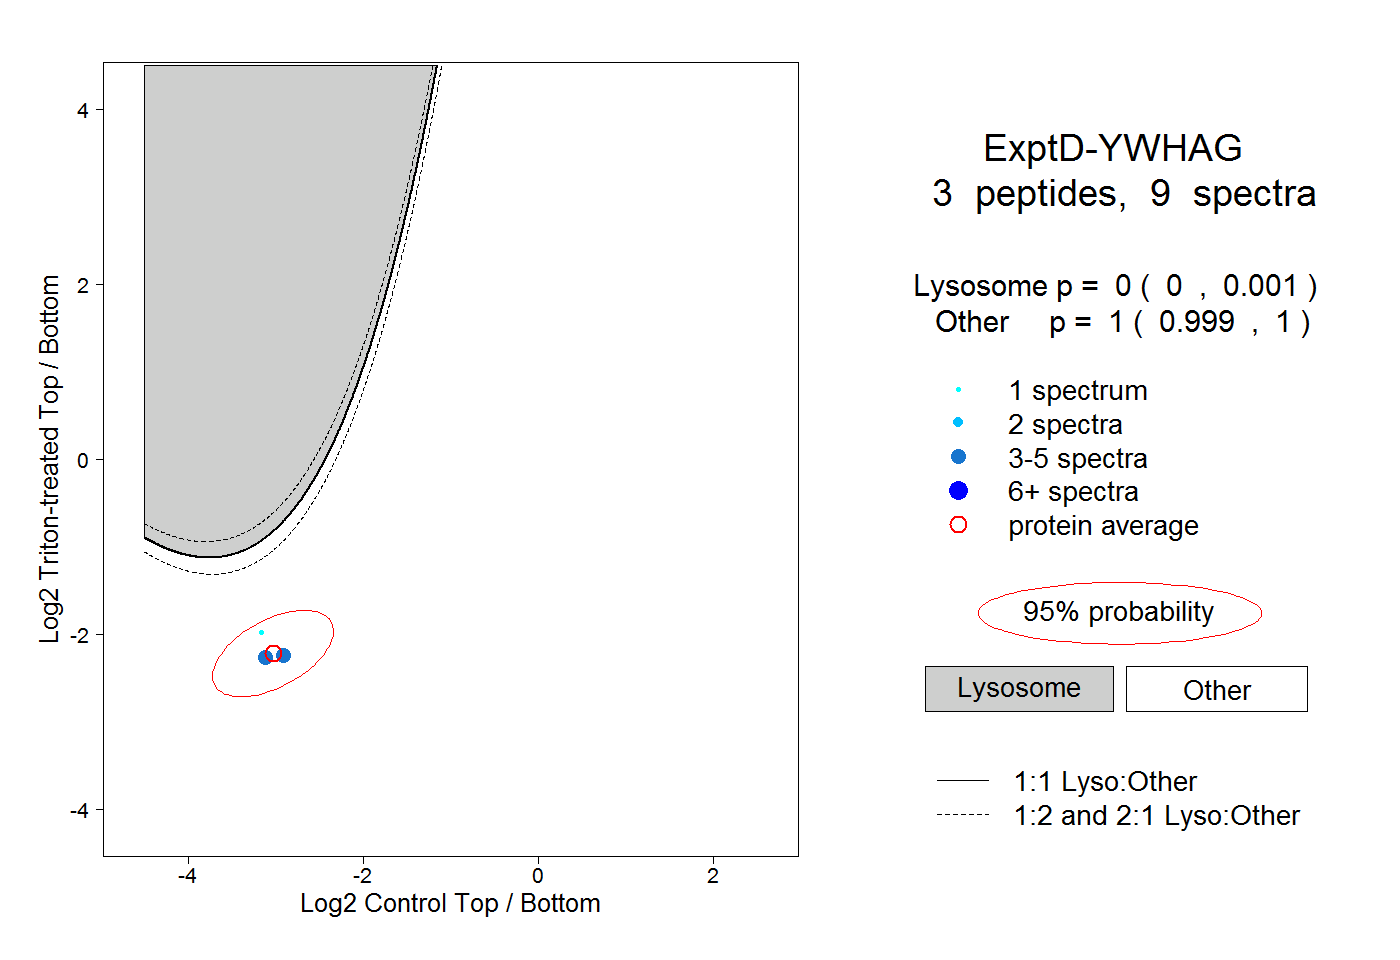
9peptides
spectra
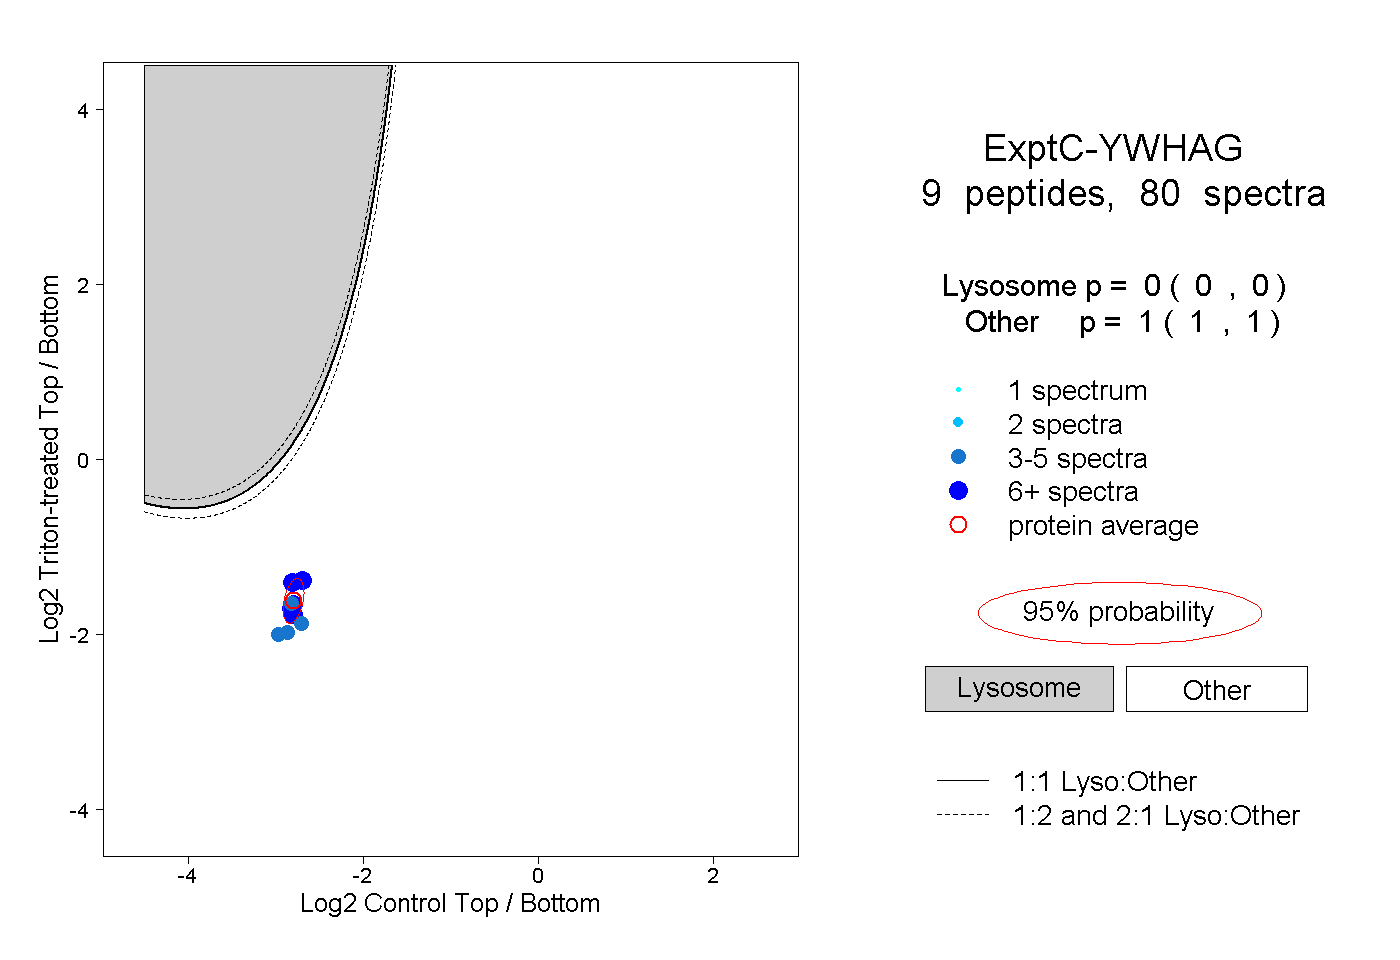
0.000 | 0.000
1.000 | 1.000