 9
9peptides
spectra
0.000 | 0.000
0.000 | 0.000
0.000 | 0.000
0.000 | 0.000
0.000 | 0.000
0.129 | 0.139
0.858 | 0.869
0.000 | 0.004
| Plot | Mito | Lyso | Perox | ER | Golgi | PM | Cytosol | Nucleus | |||||
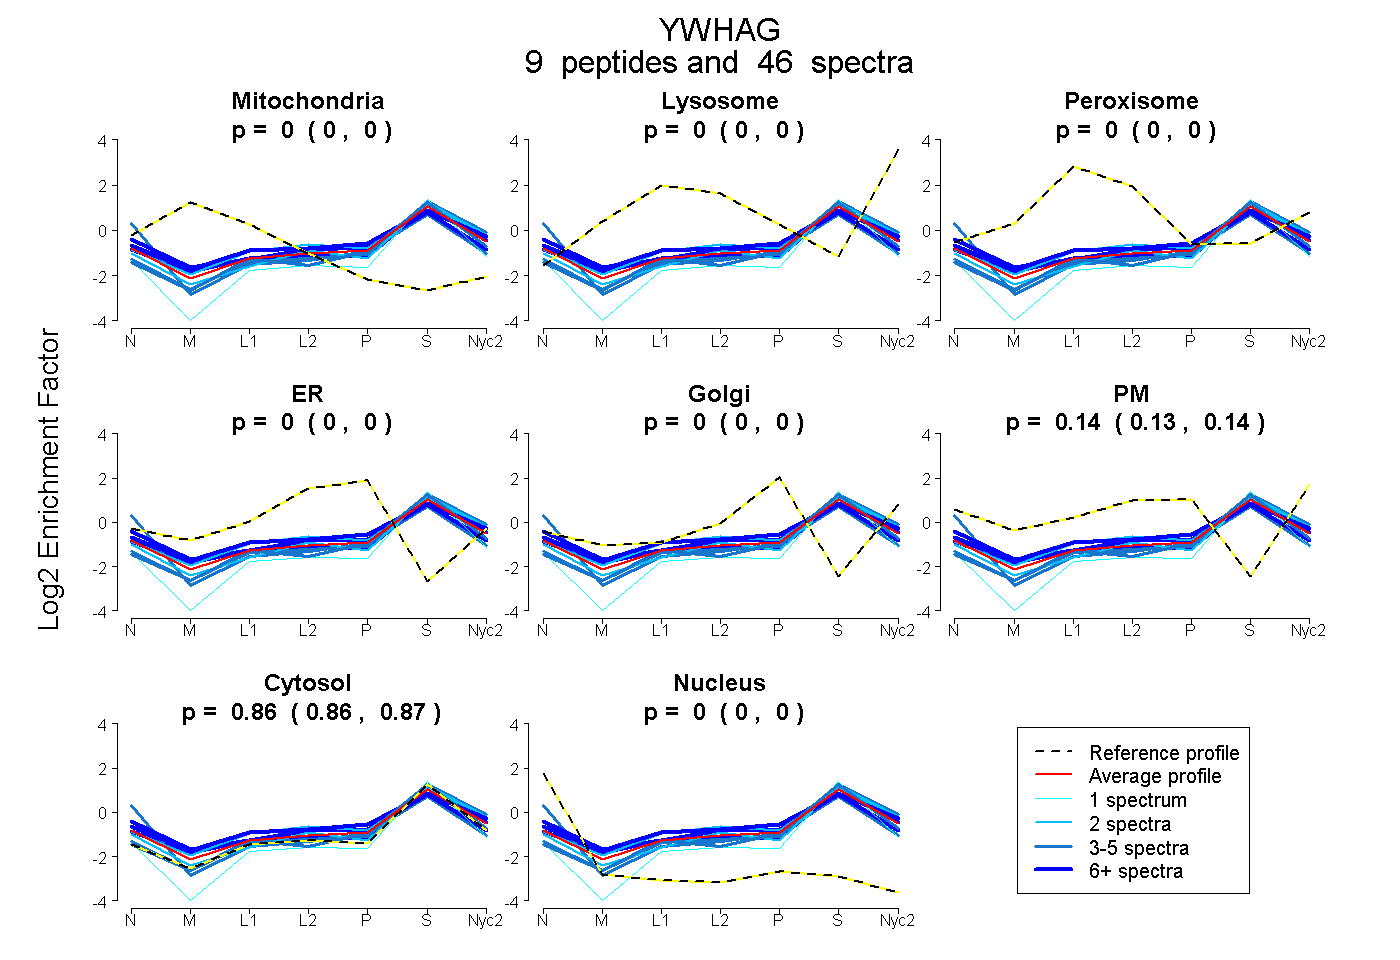
| Expt A |
9 peptides |
46 spectra |
|
0.000 0.000 | 0.000 |
0.000 0.000 | 0.000 |
0.000 0.000 | 0.000 |
0.000 0.000 | 0.000 |
0.000 0.000 | 0.000 |
0.135 0.129 | 0.139 |
0.865 0.858 | 0.869 |
0.000 0.000 | 0.004 |
| 2 spectra, NVTELNEPLSNEER | 0.000 | 0.012 | 0.079 | 0.000 | 0.000 | 0.116 | 0.793 | 0.000 | ||
| 7 spectra, EHMQPTHPIR | 0.022 | 0.000 | 0.023 | 0.037 | 0.000 | 0.128 | 0.741 | 0.048 | ||
| 3 spectra, AYSEAHEISK | 0.000 | 0.000 | 0.000 | 0.000 | 0.000 | 0.105 | 0.717 | 0.178 | ||
| 4 spectra, YLAEVATGEK | 0.000 | 0.000 | 0.000 | 0.000 | 0.040 | 0.000 | 0.960 | 0.000 | ||
| 8 spectra, ATVVESSEK | 0.030 | 0.000 | 0.021 | 0.000 | 0.000 | 0.095 | 0.854 | 0.000 | ||
| 4 spectra, EQLVQK | 0.000 | 0.064 | 0.000 | 0.000 | 0.009 | 0.000 | 0.927 | 0.000 | ||
| 1 spectrum, NCSETQYESK | 0.000 | 0.000 | 0.000 | 0.000 | 0.000 | 0.000 | 0.945 | 0.055 | ||
| 2 spectra, TSADGNEK | 0.000 | 0.021 | 0.000 | 0.000 | 0.000 | 0.068 | 0.911 | 0.000 | ||
| 15 spectra, YDDMAAAMK | 0.000 | 0.000 | 0.050 | 0.000 | 0.000 | 0.199 | 0.751 | 0.000 |
| Plot | Mito | Lyso or Perox | ER | Golgi | PM | Cytosol | Nucleus | ||||||
| Expt B |
4 peptides |
15 spectra |
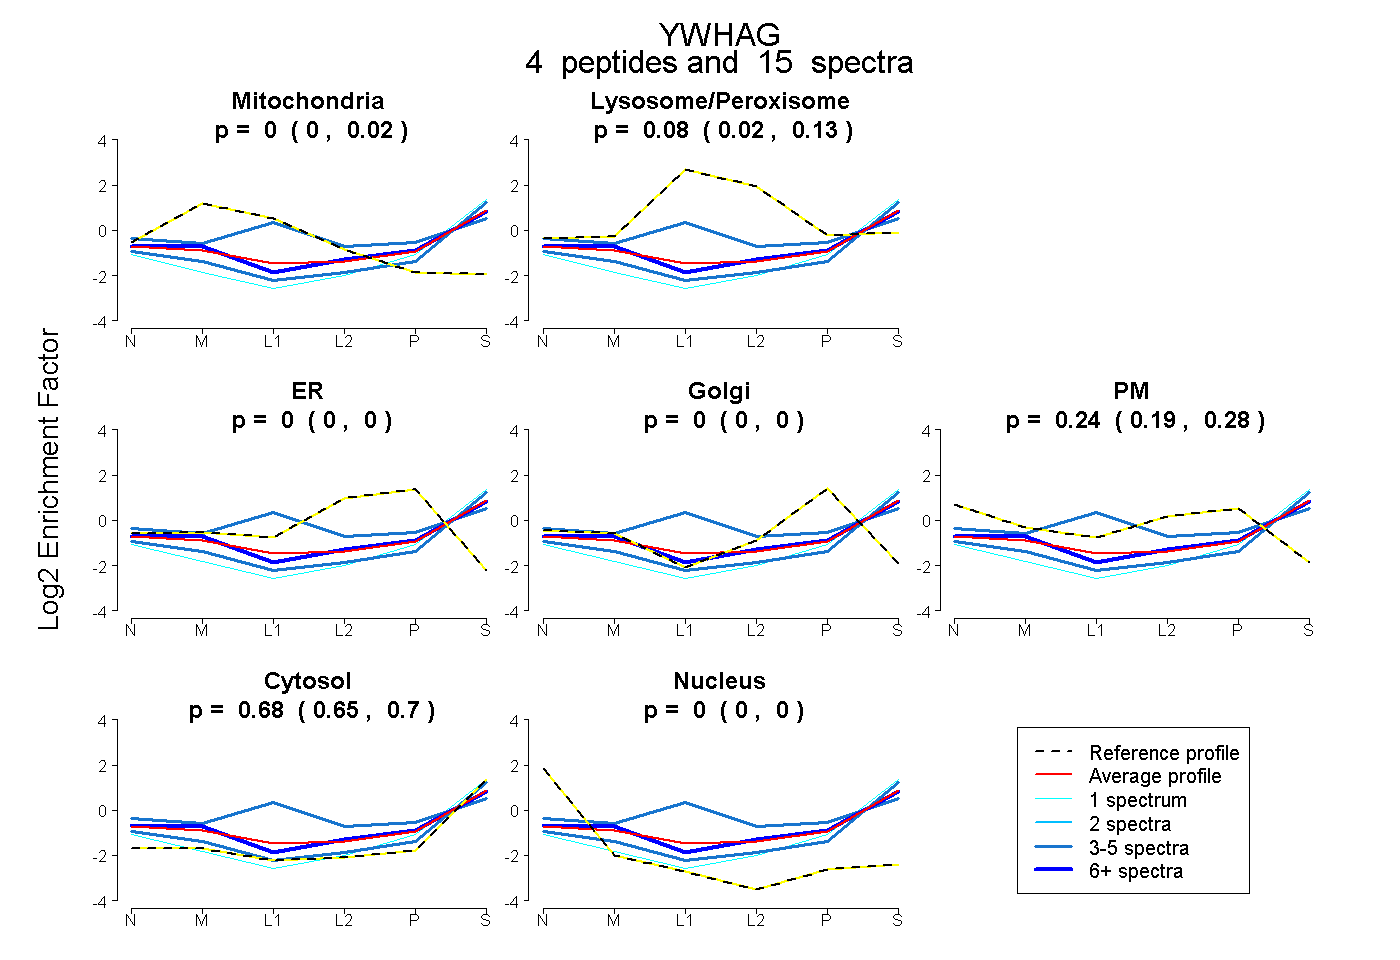 |
0.000 0.000 | 0.021 |
0.079 0.022 | 0.131 |
0.000 0.000 | 0.000 |
0.000 0.000 | 0.000 |
0.239 0.186 | 0.279 |
0.682 0.654 | 0.701 |
0.000 0.000 | 0.000 |
|||
| Plot | Lyso | Other | |||||||||||
| Expt C |
9 peptides |
80 spectra |
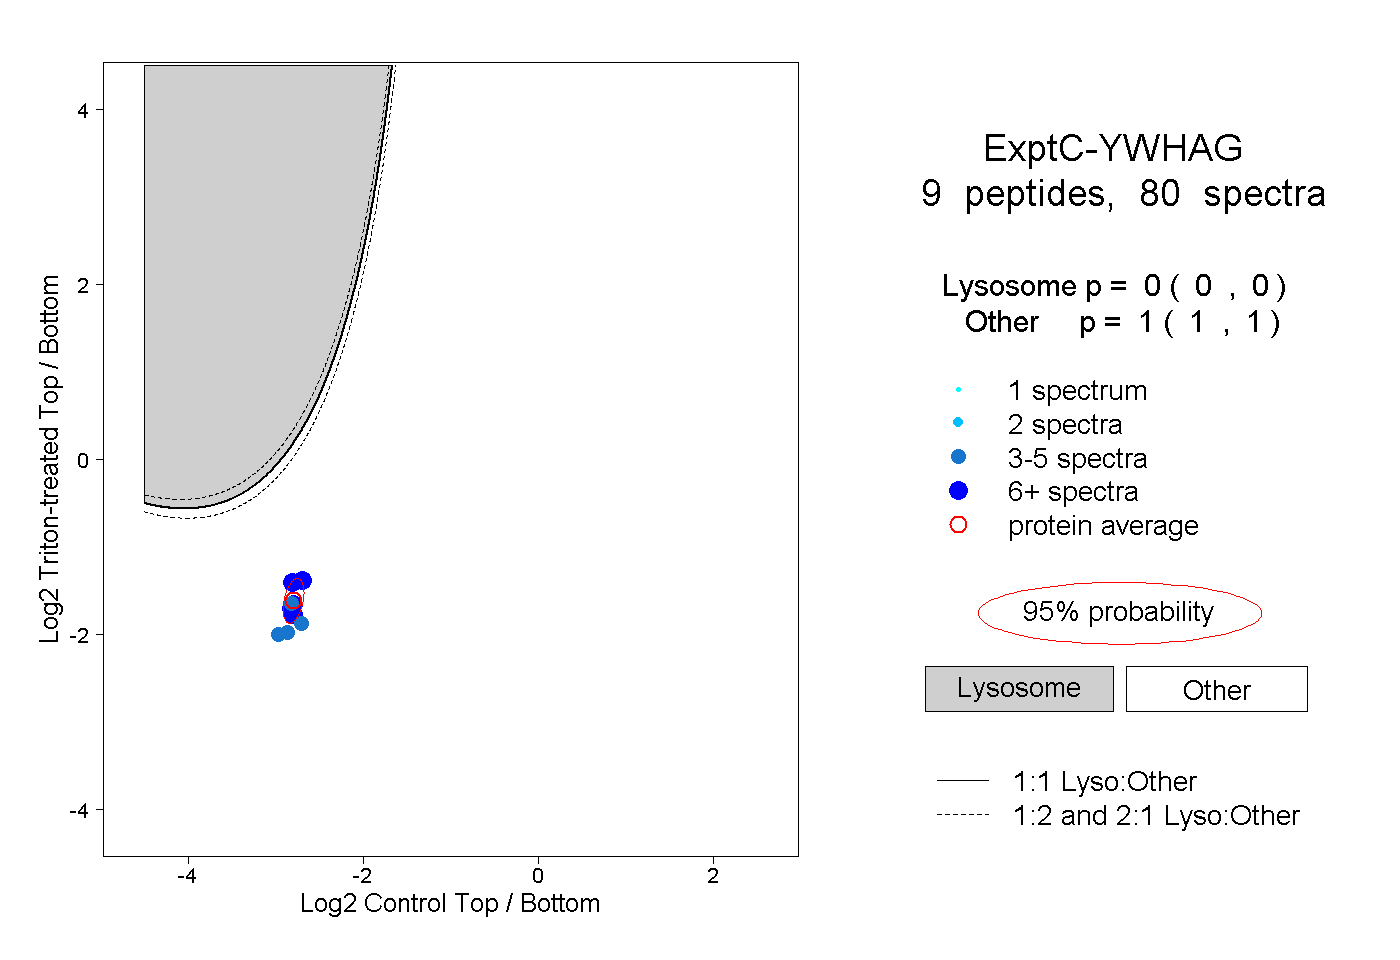 |
0.000 0.000 | 0.000 |
1.000 1.000 | 1.000 |
||||||||
| Plot | Lyso | Other | |||||||||||
| Expt D |
3 peptides |
9 spectra |
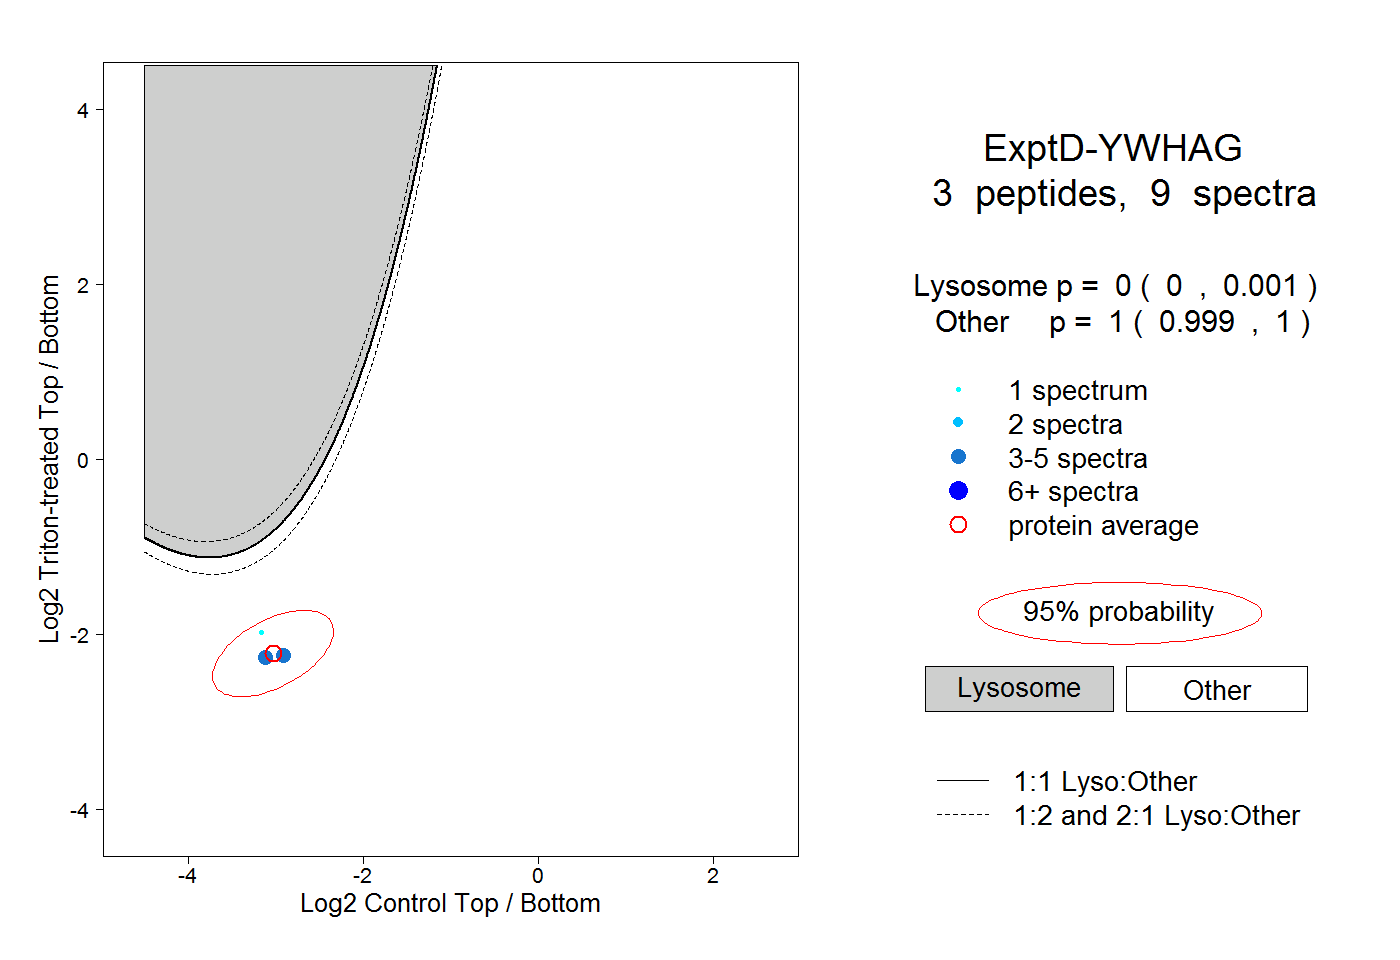 |
0.000 0.000 | 0.001 |
1.000 0.999 | 1.000 |