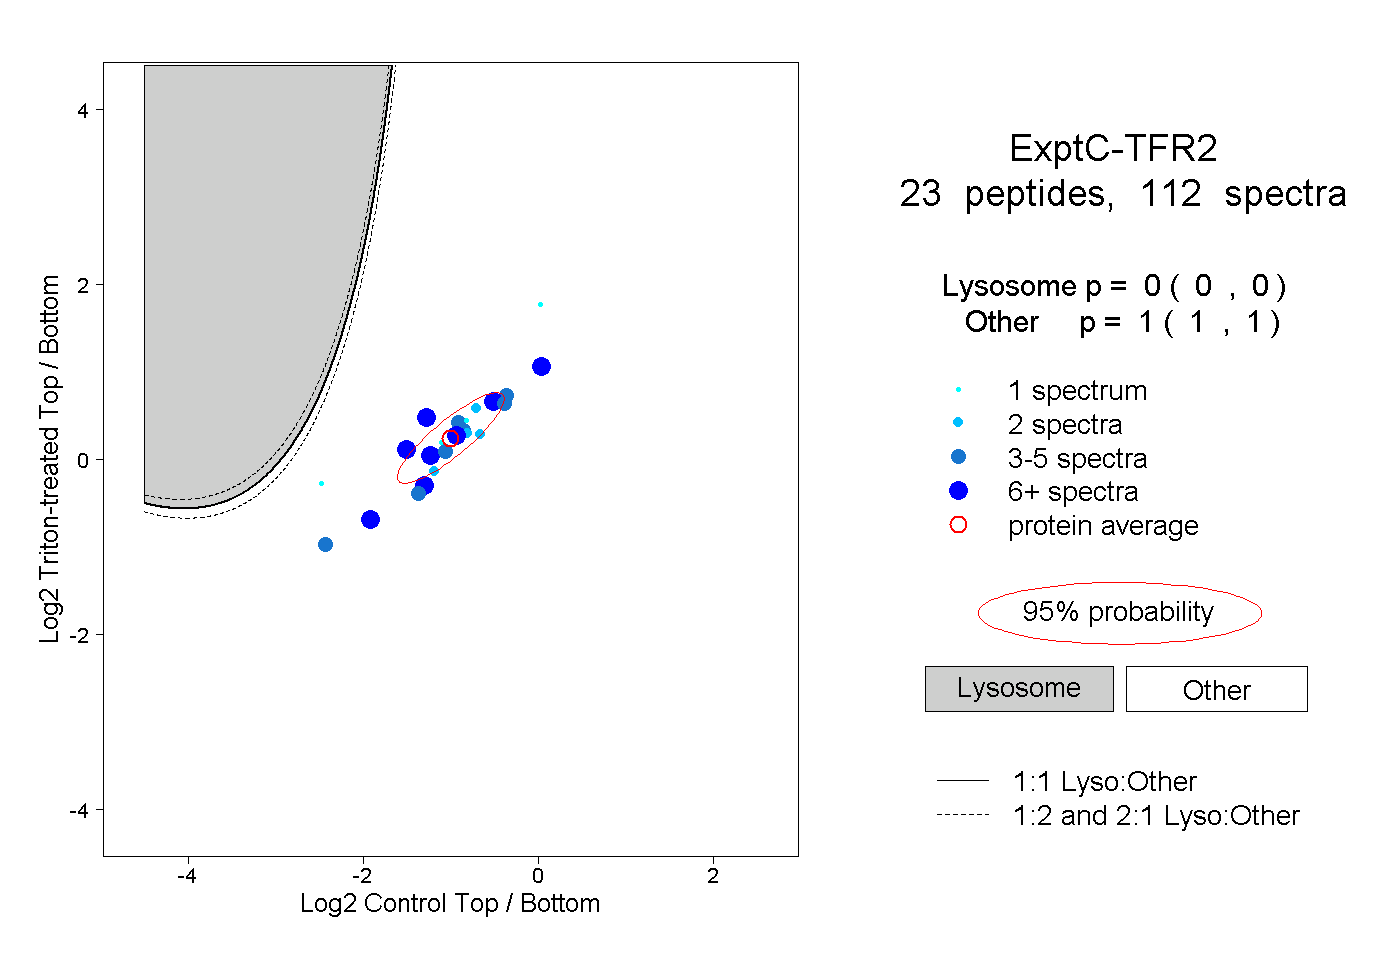
23
23peptides
spectra
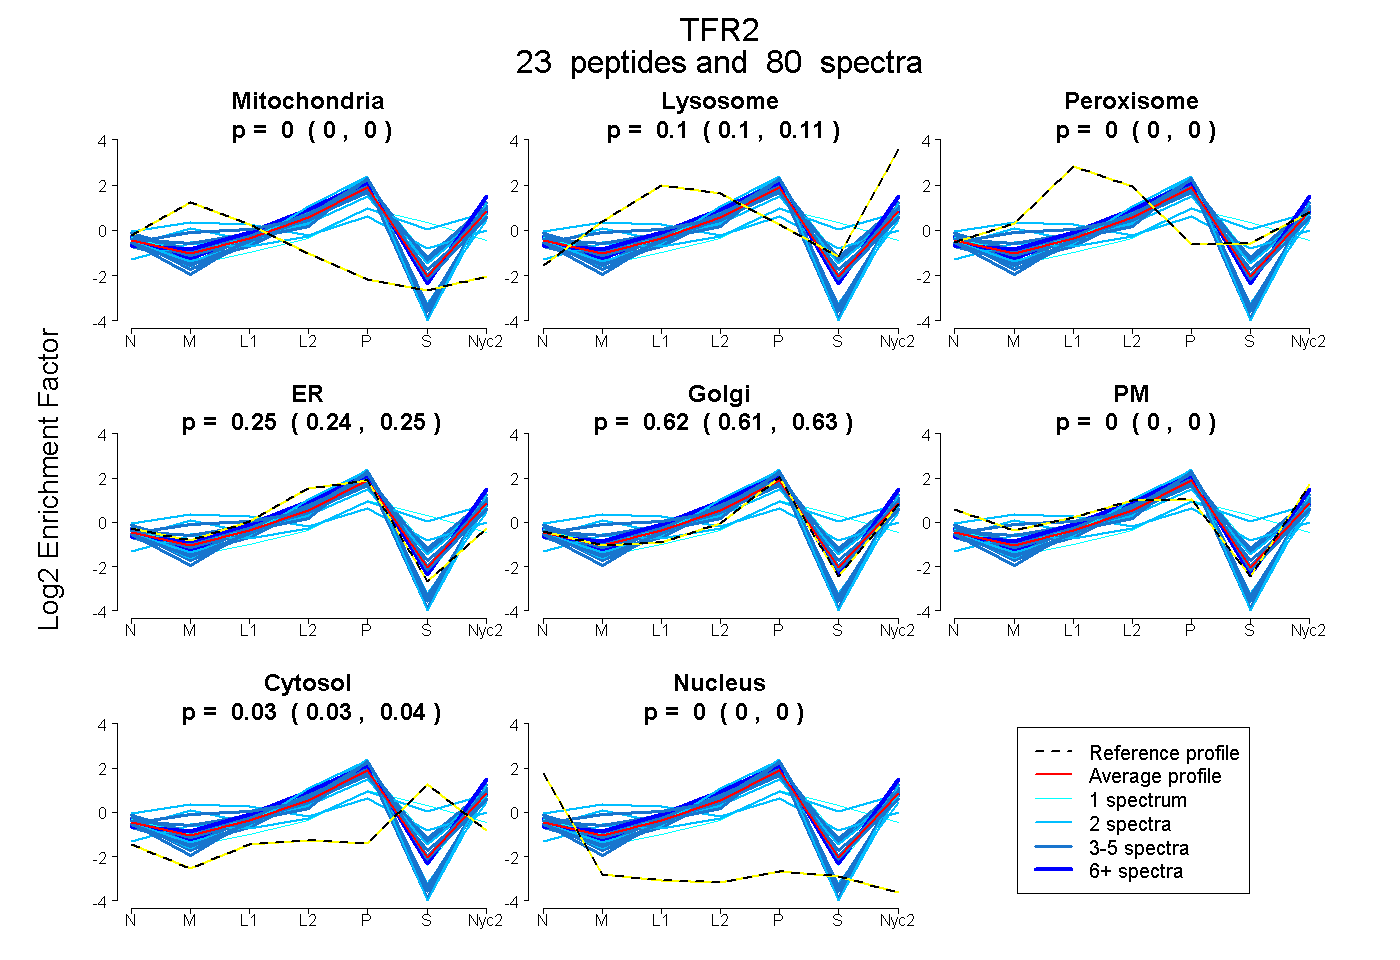
0.000 | 0.000
0.100 | 0.107
0.000 | 0.000
0.239 | 0.253
0.607 | 0.626
0.000 | 0.000
0.025 | 0.037
0.000 | 0.000
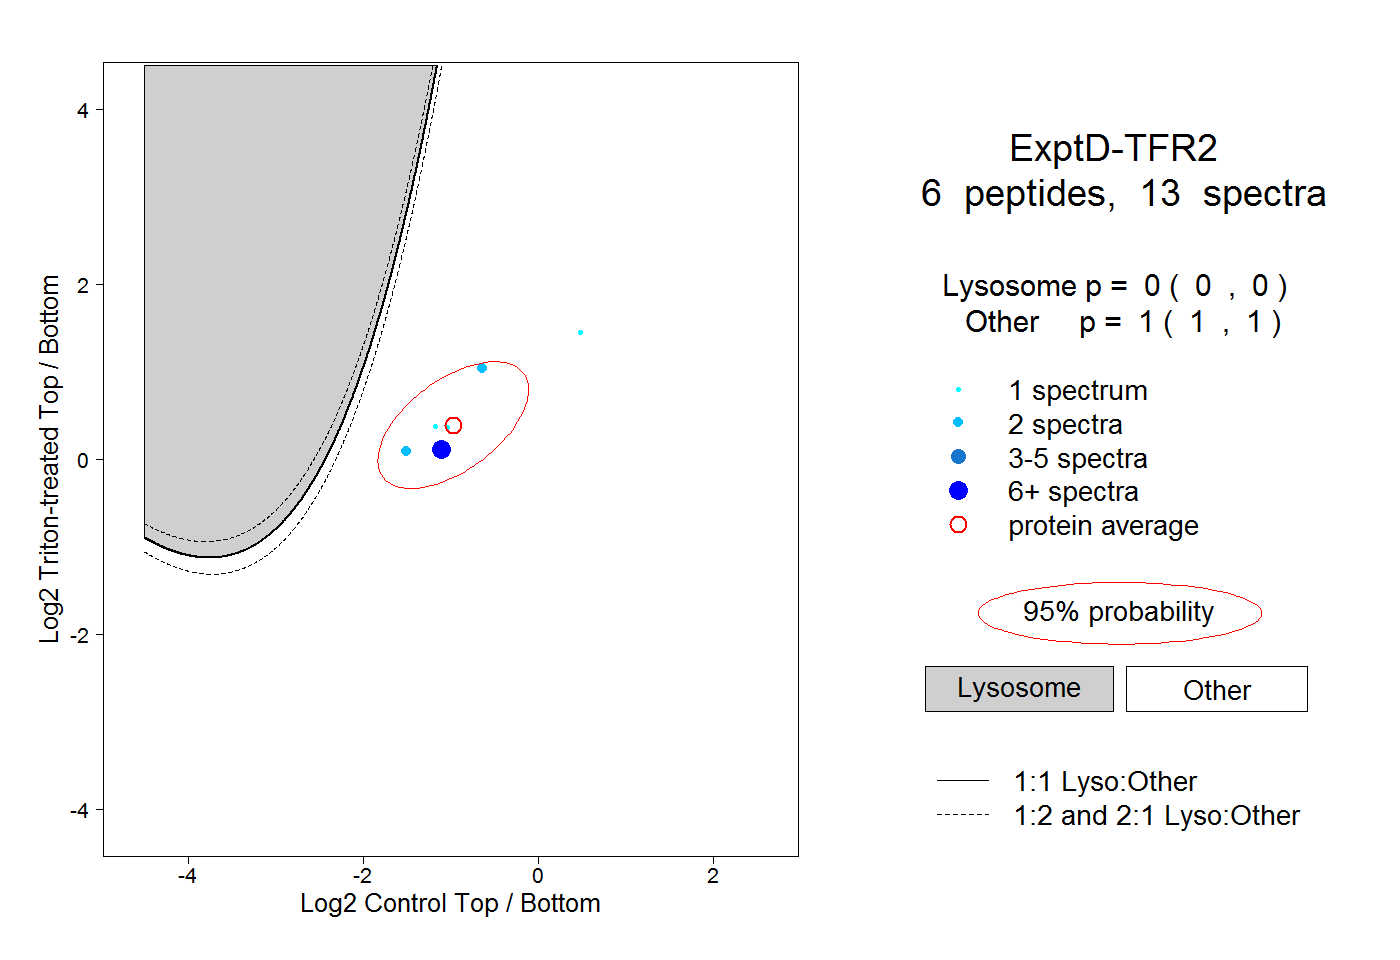
9peptides
spectra
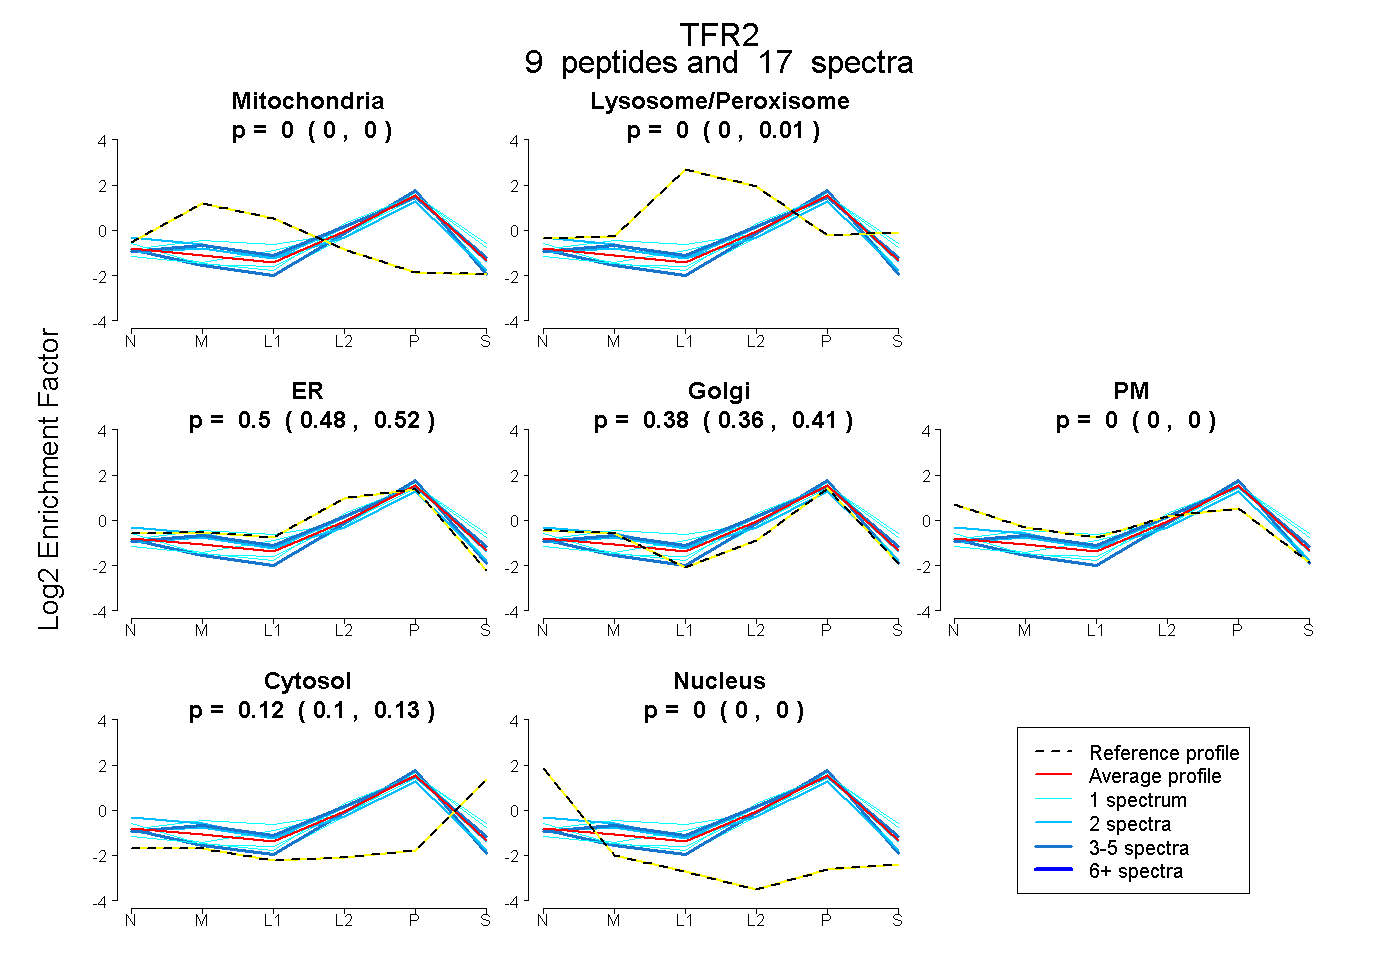
0.000 | 0.000
0.000 | 0.006
0.475 | 0.517
0.356 | 0.406
0.000 | 0.000
0.105 | 0.127
0.000 | 0.000