| 36 spectra, ENMDVLEELK |
|
0.000 |
|
|
|
|
|
|
|
1.000 |
| 28 spectra, EVVSHVIK |
|
0.000 |
|
|
|
|
|
|
|
1.000 |
| 16 spectra, GMEFLAVPSSYYR |
|
0.000 |
|
|
|
|
|
|
|
1.000 |
| 11 spectra, GNLTDLETNGVR |
|
0.000 |
|
|
|
|
|
|
|
1.000 |
| 1 spectrum, FWSVDDTQVHTEYSSLR |
|
0.000 |
|
|
|
|
|
|
|
1.000 |
| 32 spectra, MPINEPAPGR |
|
0.000 |
|
|
|
|
|
|
|
1.000 |
| 29 spectra, ILVDYDEK |
|
0.000 |
|
|
|
|
|
|
|
1.000 |
| 10 spectra, GLETGSR |
|
0.000 |
|
|
|
|
|
|
|
1.000 |
| 47 spectra, INYTGR |
|
0.000 |
|
|
|
|
|
|
|
1.000 |
| 19 spectra, MGFEPLAYK |
|
0.000 |
|
|
|
|
|
|
|
1.000 |
| 22 spectra, TEDIITTIR |
|
0.000 |
|
|
|
|
|
|
|
1.000 |
| 14 spectra, FLPGFEAPTYK |
|
0.000 |
|
|
|
|
|
|
|
1.000 |
| 53 spectra, AFEEEQALR |
|
0.000 |
|
|
|
|
|
|
|
1.000 |
| 54 spectra, EMGDHLVK |
|
0.000 |
|
|
|
|
|
|
|
1.000 |
| 19 spectra, HGDGVK |
|
0.000 |
|
|
|
|
|
|
|
1.000 |
| 24 spectra, NLQFHR |
|
0.000 |
|
|
|
|
|
|
|
1.000 |
| 12 spectra, QAASFYCNK |
|
0.000 |
|
|
|
|
|
|
|
1.000 |
| 13 spectra, SIVVANYEESIK |
|
0.000 |
|
|
|
|
|
|
|
1.000 |
| 4 spectra, EPWVEEDK |
|
0.000 |
|
|
|
|
|
|
|
1.000 |
| 11 spectra, DIAFEVEDCEHIVQK |
|
0.000 |
|
|
|
|
|
|
|
1.000 |
| 29 spectra, FAVLQTYGDTTHTLVEK |
|
0.000 |
|
|
|
|
|
|
|
1.000 |
| 9 spectra, SQIQEYVDYNGGAGVQHIALR |
|
0.000 |
|
|
|
|
|
|
|
1.000 |
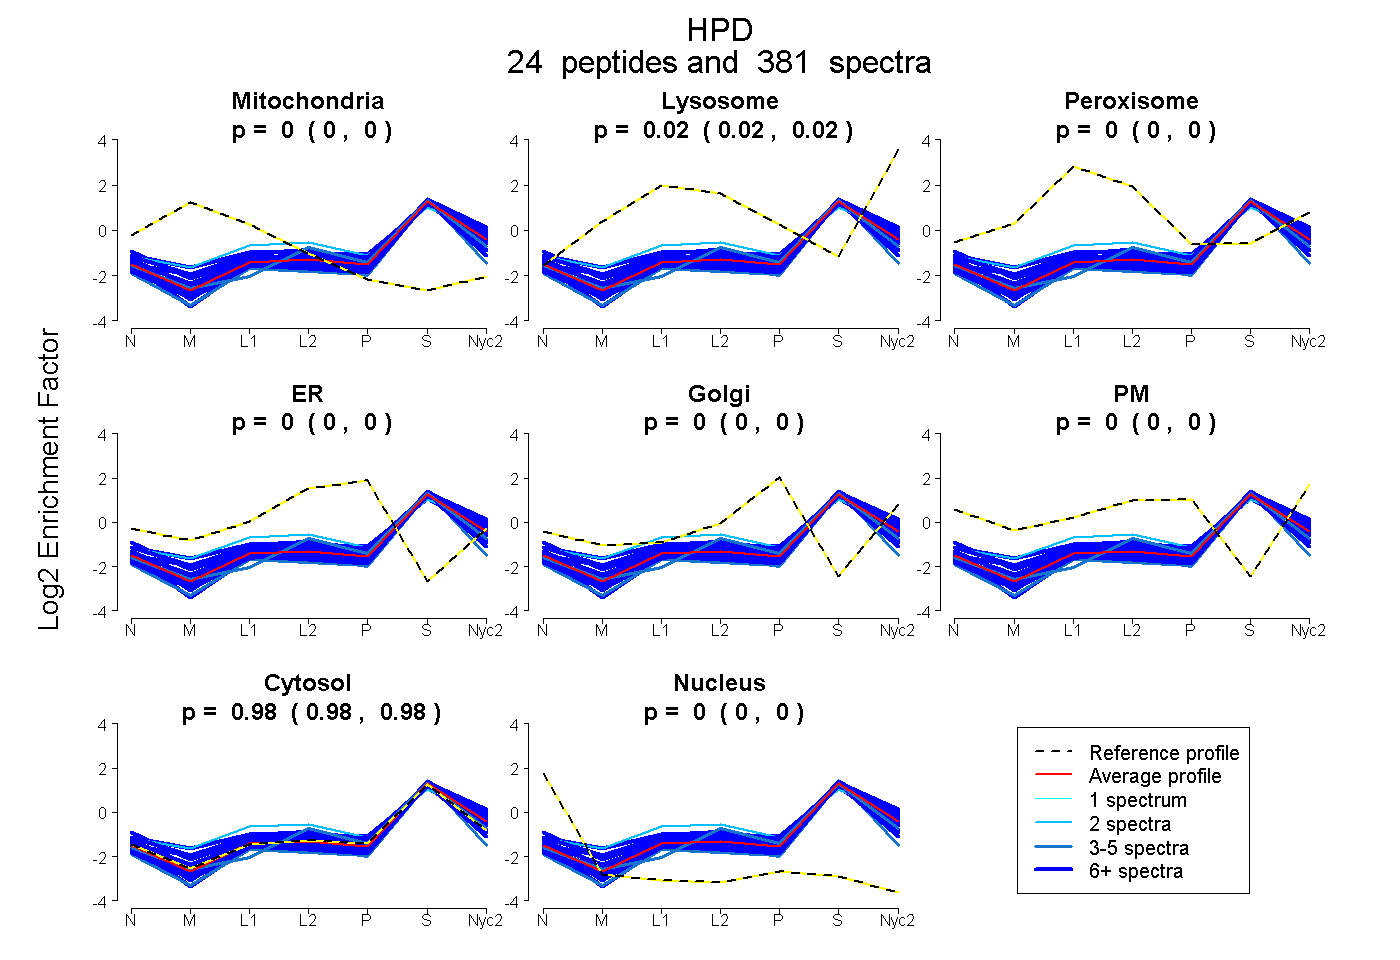
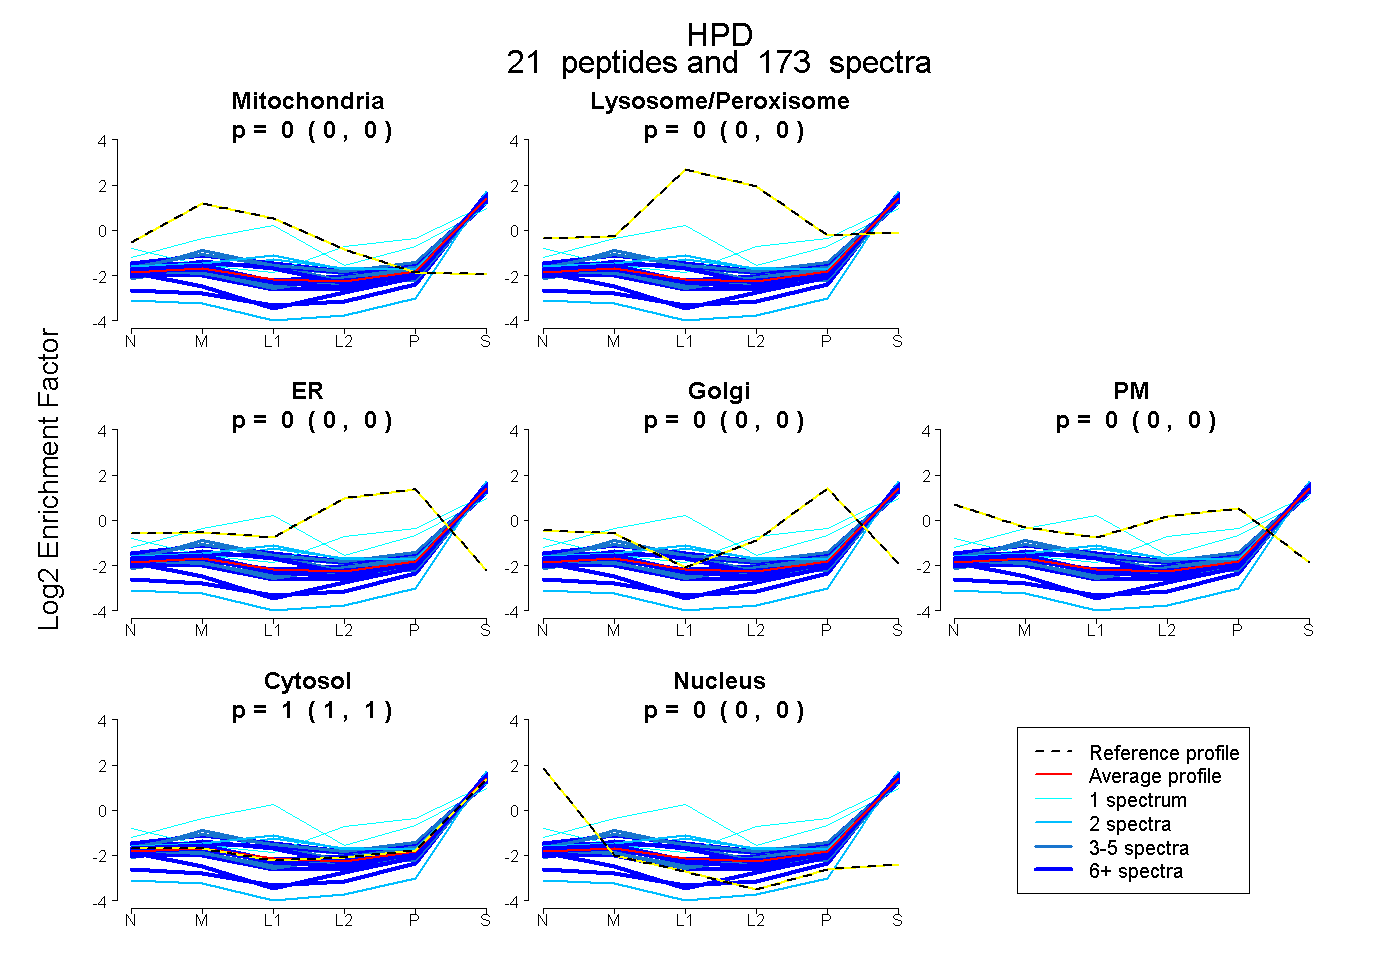
 24
24