 3
3peptides
spectra
0.000 | 0.000
0.000 | 0.000
0.000 | 0.000
0.056 | 0.156
0.000 | 0.000
0.832 | 0.936
0.000 | 0.000
0.000 | 0.000
| Plot | Mito | Lyso | Perox | ER | Golgi | PM | Cytosol | Nucleus | |||||
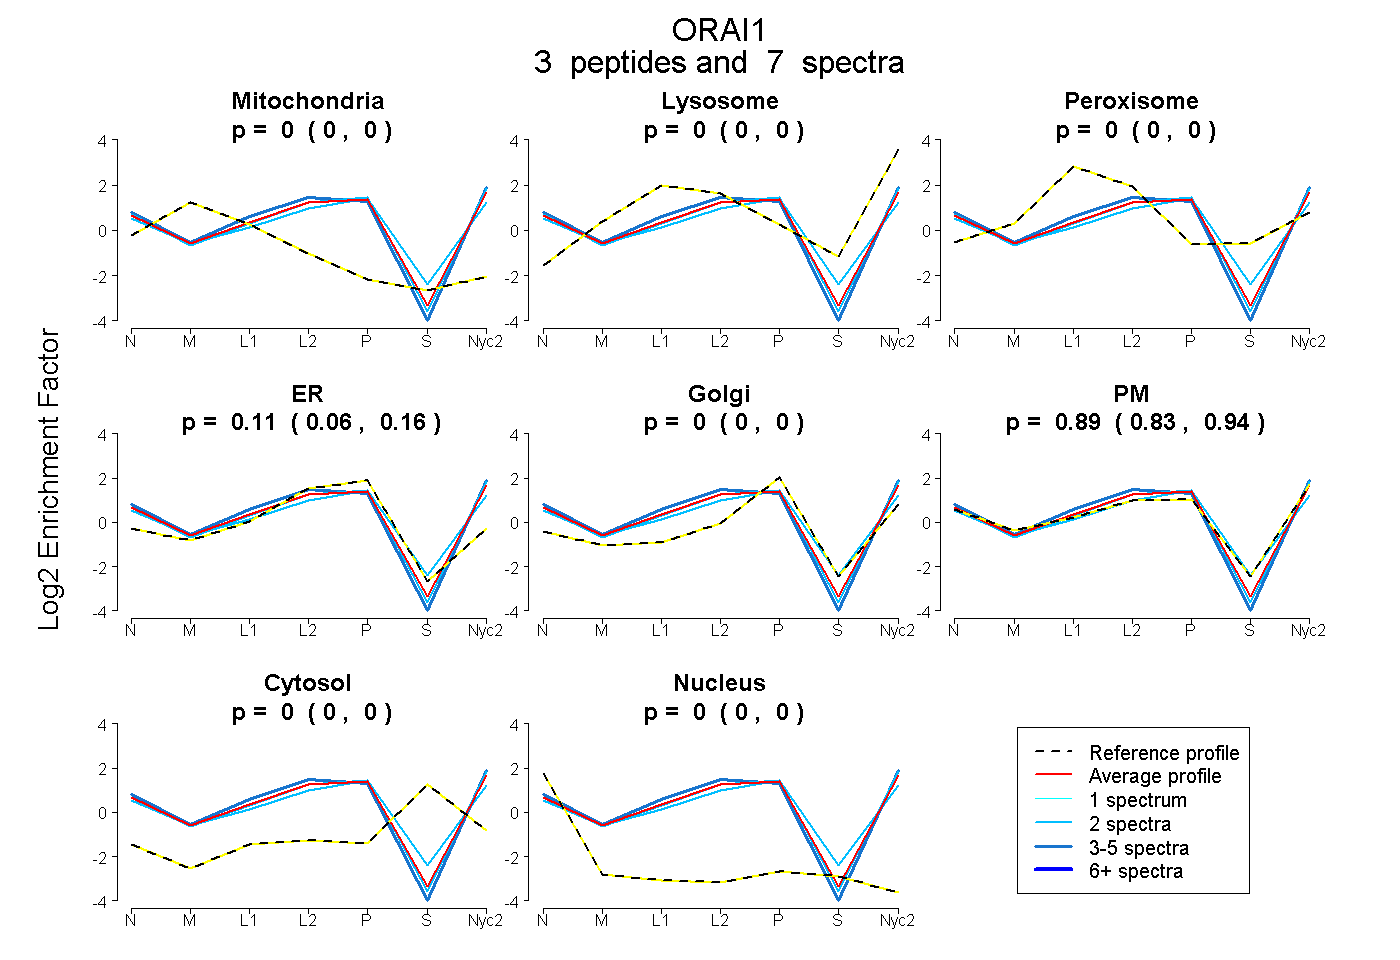
| Expt A |
3 peptides |
7 spectra |
|
0.000 0.000 | 0.000 |
0.000 0.000 | 0.000 |
0.000 0.000 | 0.000 |
0.110 0.056 | 0.156 |
0.000 0.000 | 0.000 |
0.890 0.832 | 0.936 |
0.000 0.000 | 0.000 |
0.000 0.000 | 0.000 |
| 3 spectra, LQDQLDHR | 0.000 | 0.000 | 0.000 | 0.046 | 0.000 | 0.954 | 0.000 | 0.000 | ||
| 2 spectra, FILKPR | 0.000 | 0.000 | 0.000 | 0.183 | 0.084 | 0.733 | 0.000 | 0.000 | ||
| 2 spectra, QFQELNELAEFAR | 0.000 | 0.000 | 0.000 | 0.067 | 0.000 | 0.933 | 0.000 | 0.000 |
| Plot | Mito | Lyso or Perox | ER | Golgi | PM | Cytosol | Nucleus | ||||||
| Expt B |
1 peptide |
1 spectrum |
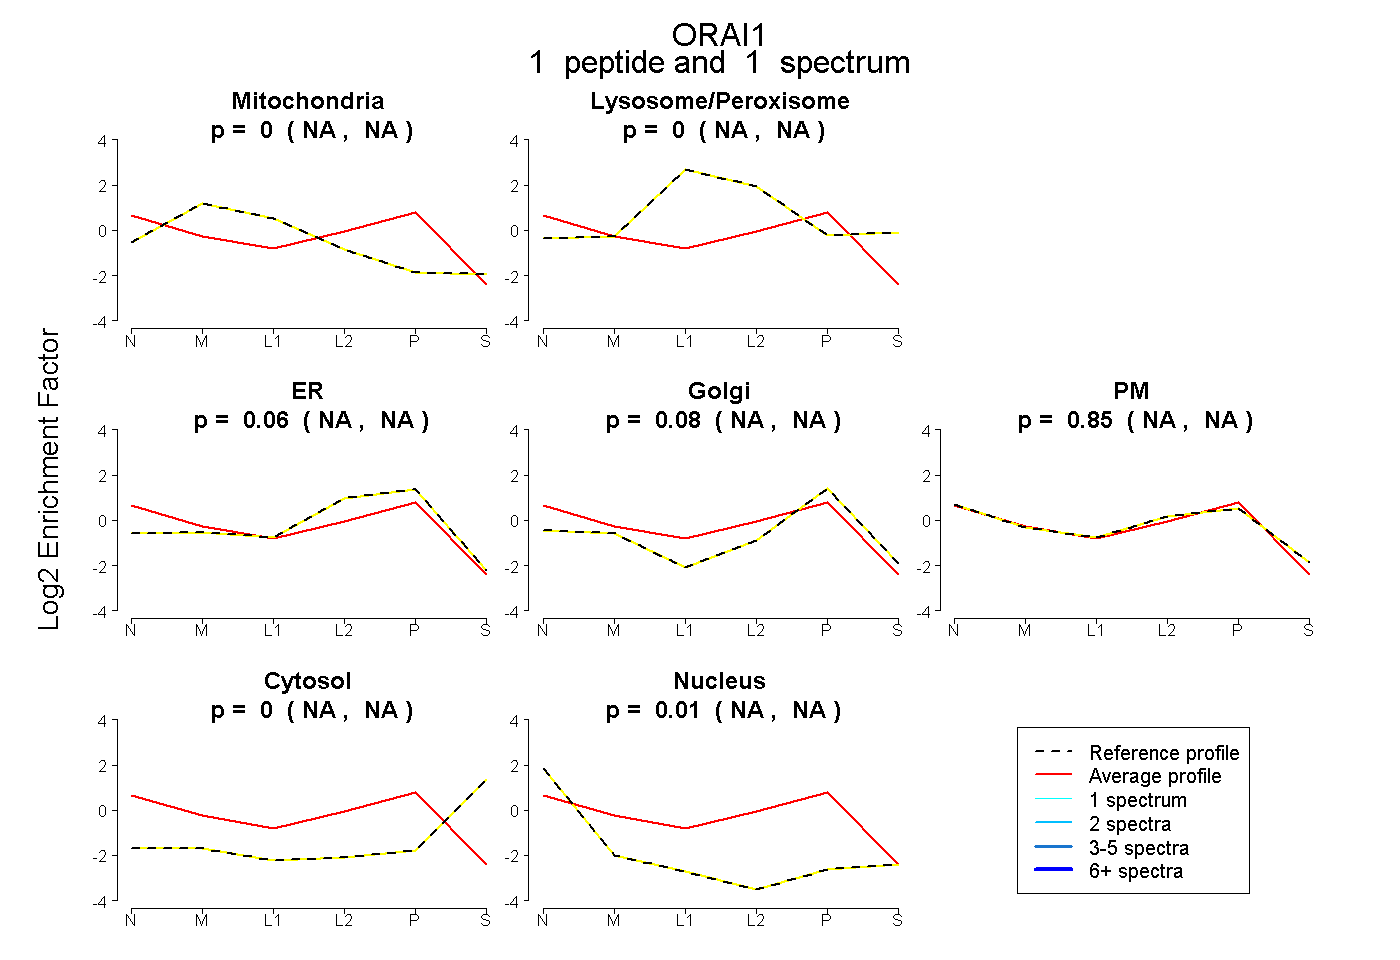 |
0.000 NA | NA |
0.000 NA | NA |
0.062 NA | NA |
0.081 NA | NA |
0.850 NA | NA |
0.000 NA | NA |
0.007 NA | NA |
|||
| Plot | Lyso | Other | |||||||||||
| Expt C |
2 peptides |
5 spectra |
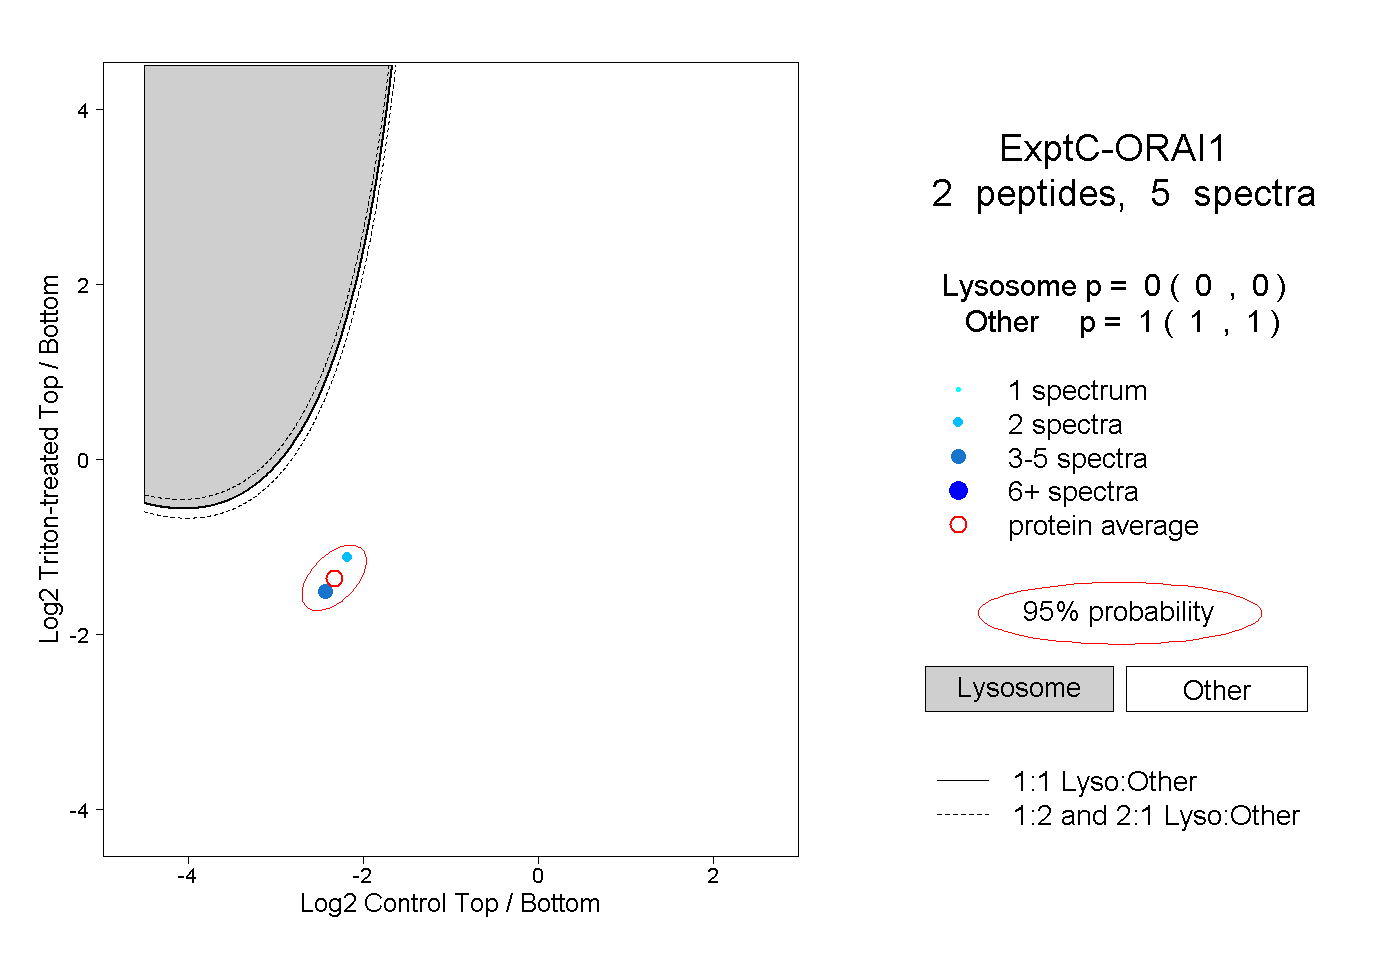 |
0.000 0.000 | 0.000 |
1.000 1.000 | 1.000 |