AZGP1
[ENSRNOP00000001801]
Main page
| | | Plot |
Mito |
Lyso |
|
Perox |
ER |
Golgi |
PM |
Cytosol |
Nucleus |
|
| Expt A |
 10
10
peptides |
25
spectra |
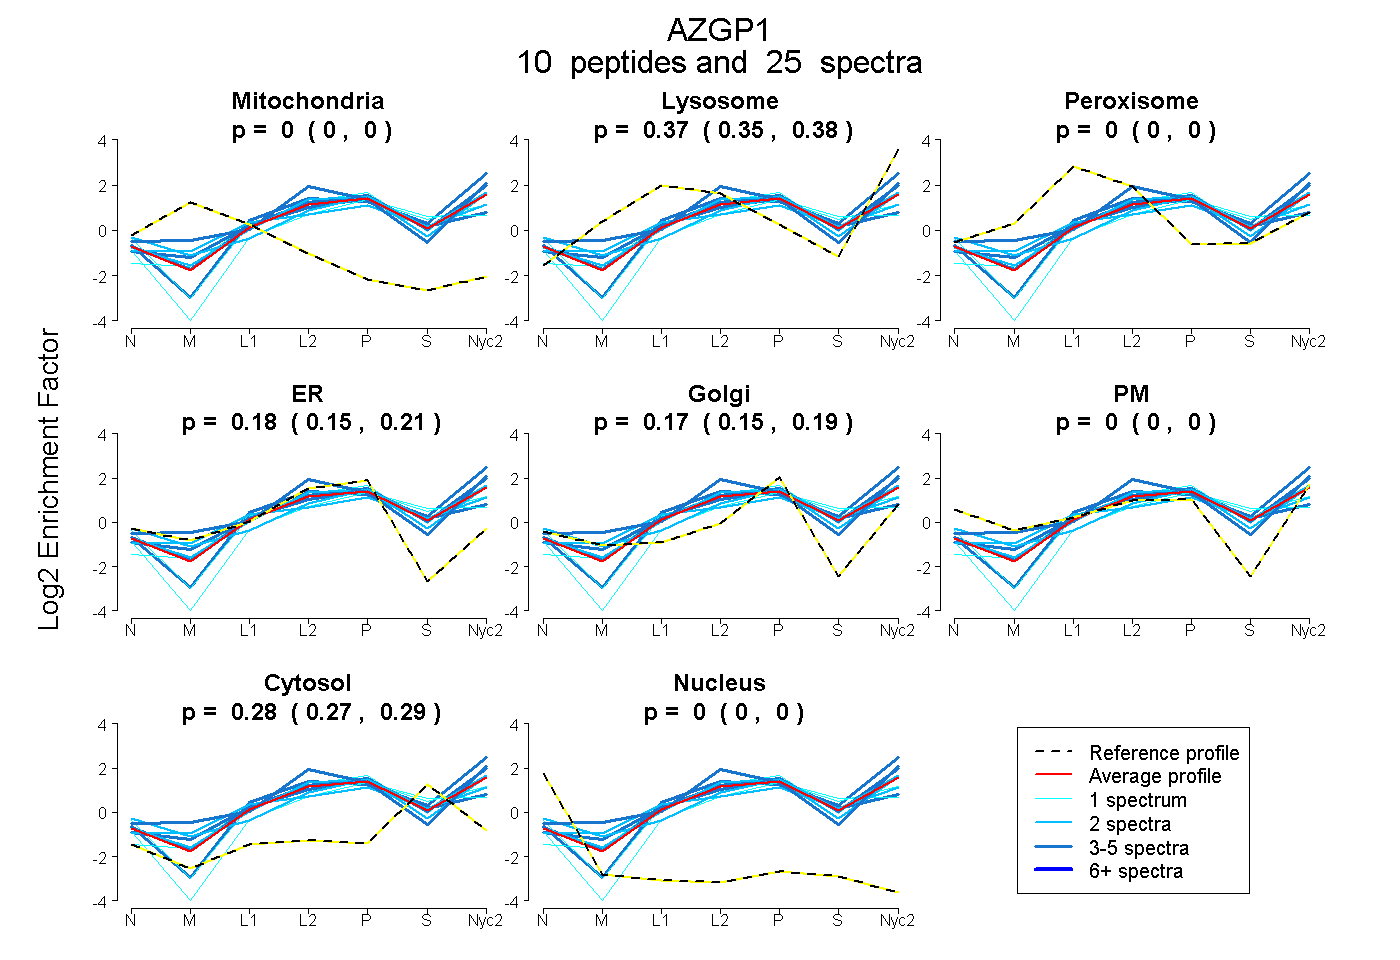 |
0.000
0.000 | 0.000 |
0.367
0.353 | 0.379 |
|
0.000
0.000 | 0.000 |
0.184
0.155 | 0.208 |
0.171
0.145 | 0.193 |
0.000
0.000 | 0.000 |
0.278
0.268 | 0.286 |
0.000
0.000 | 0.000 |
|
| | | Plot |
Mito |
|
Lyso or Perox |
|
ER |
Golgi |
PM |
Cytosol |
Nucleus |
|
| Expt B |
3
peptides |
6
spectra |
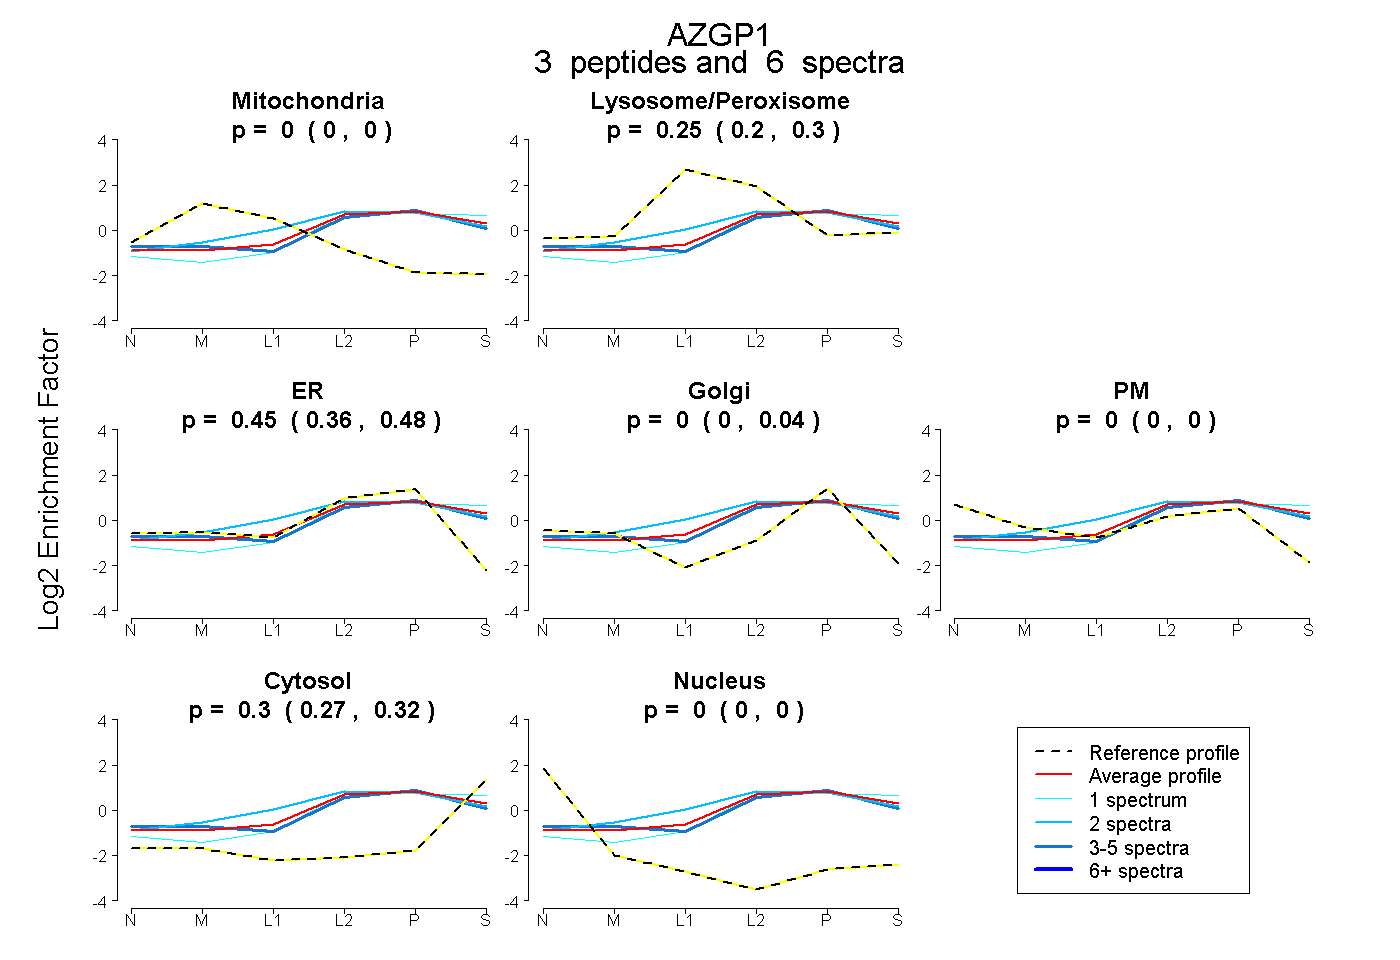 |
0.000
0.000 | 0.000 |
|
0.250
0.200 | 0.303 |
|
0.447
0.358 | 0.480 |
0.000
0.000 | 0.041 |
0.000
0.000 | 0.000 |
0.303
0.268 | 0.323 |
0.000
0.000 | 0.000 |
|
| 3 spectra, LASEPER |
0.000 |
|
0.195 |
|
0.455 |
0.070 |
0.000 |
0.280 |
0.000 |
|
| 2 spectra, YLTYSR |
0.000 |
|
0.401 |
|
0.308 |
0.079 |
0.000 |
0.213 |
0.000 |
|
| 1 spectrum, DPFVCHIEHK |
0.000 |
|
0.211 |
|
0.407 |
0.000 |
0.000 |
0.383 |
0.000 |
|
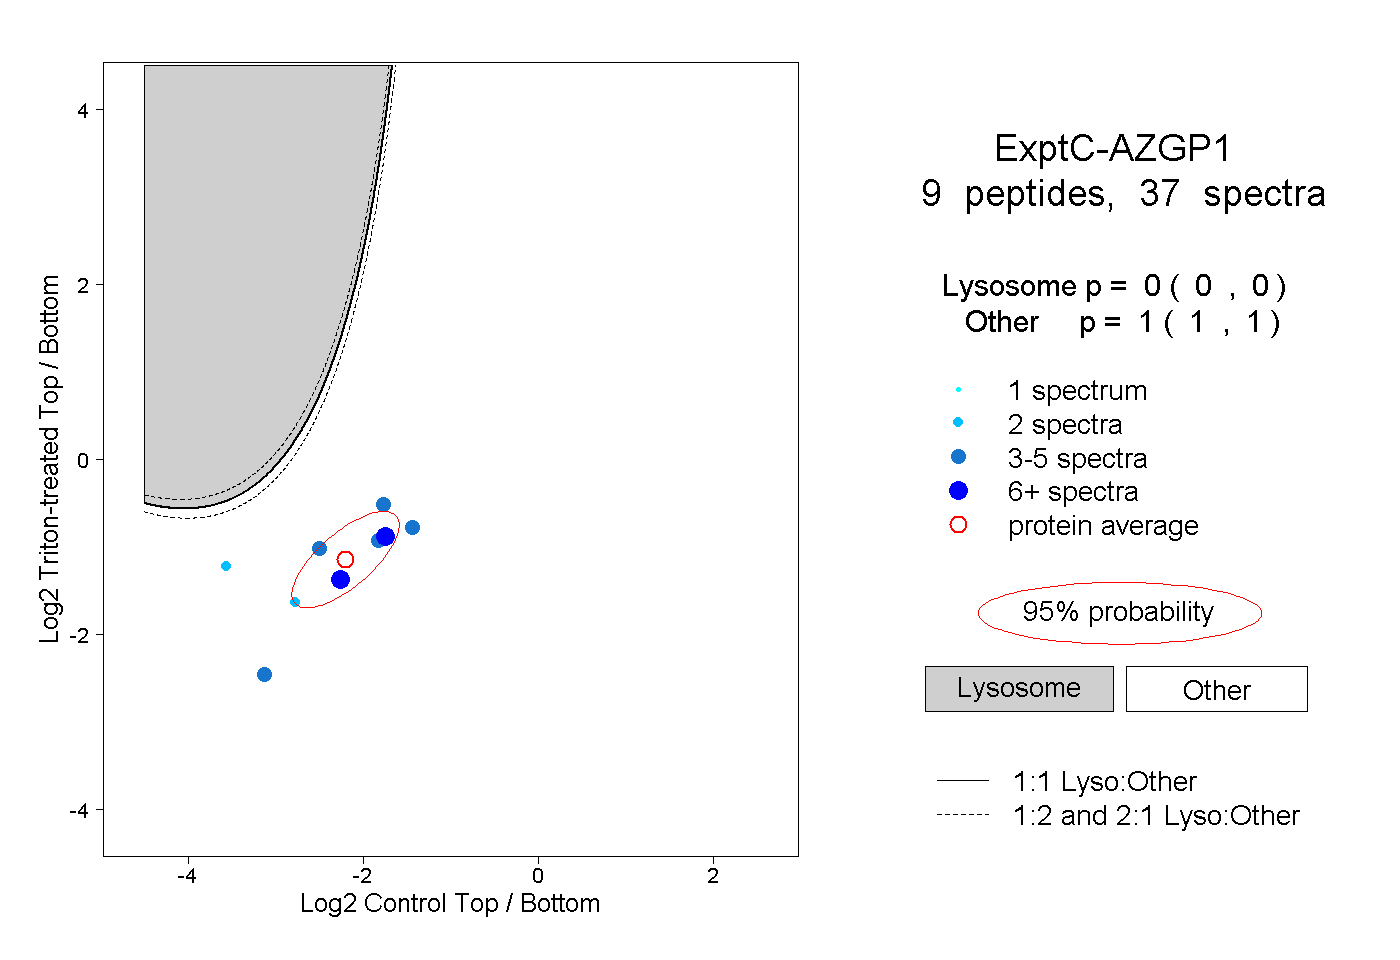
| | | Plot |
|
Lyso |
|
|
|
|
|
|
|
Other |
| Expt C |
9
peptides |
37
spectra |
 |
|
0.000
0.000 | 0.000 |
|
|
|
|
|
|
|
1.000
1.000 | 1.000 |
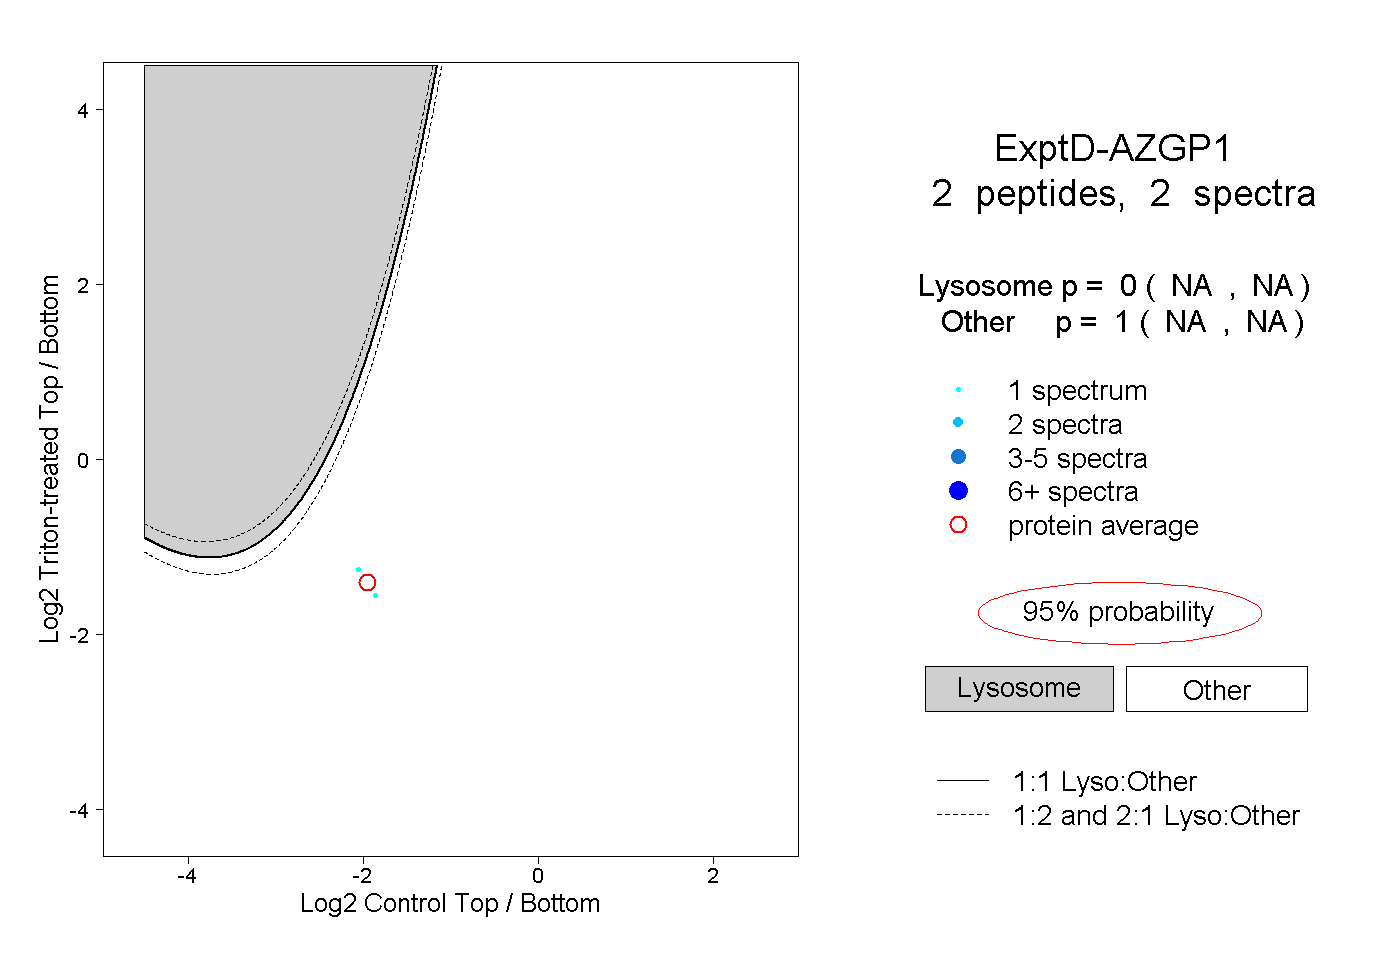
| | | Plot |
|
Lyso |
|
|
|
|
|
|
|
Other |
| Expt D |
2
peptides |
2
spectra |
 |
|
0.000
NA | NA |
|
|
|
|
|
|
|
1.000
NA | NA |