 2
2peptides
spectra
0.000 | 0.000
0.000 | 0.085
0.000 | 0.000
0.024 | 0.152
0.609 | 0.772
0.000 | 0.058
0.116 | 0.169
0.000 | 0.000
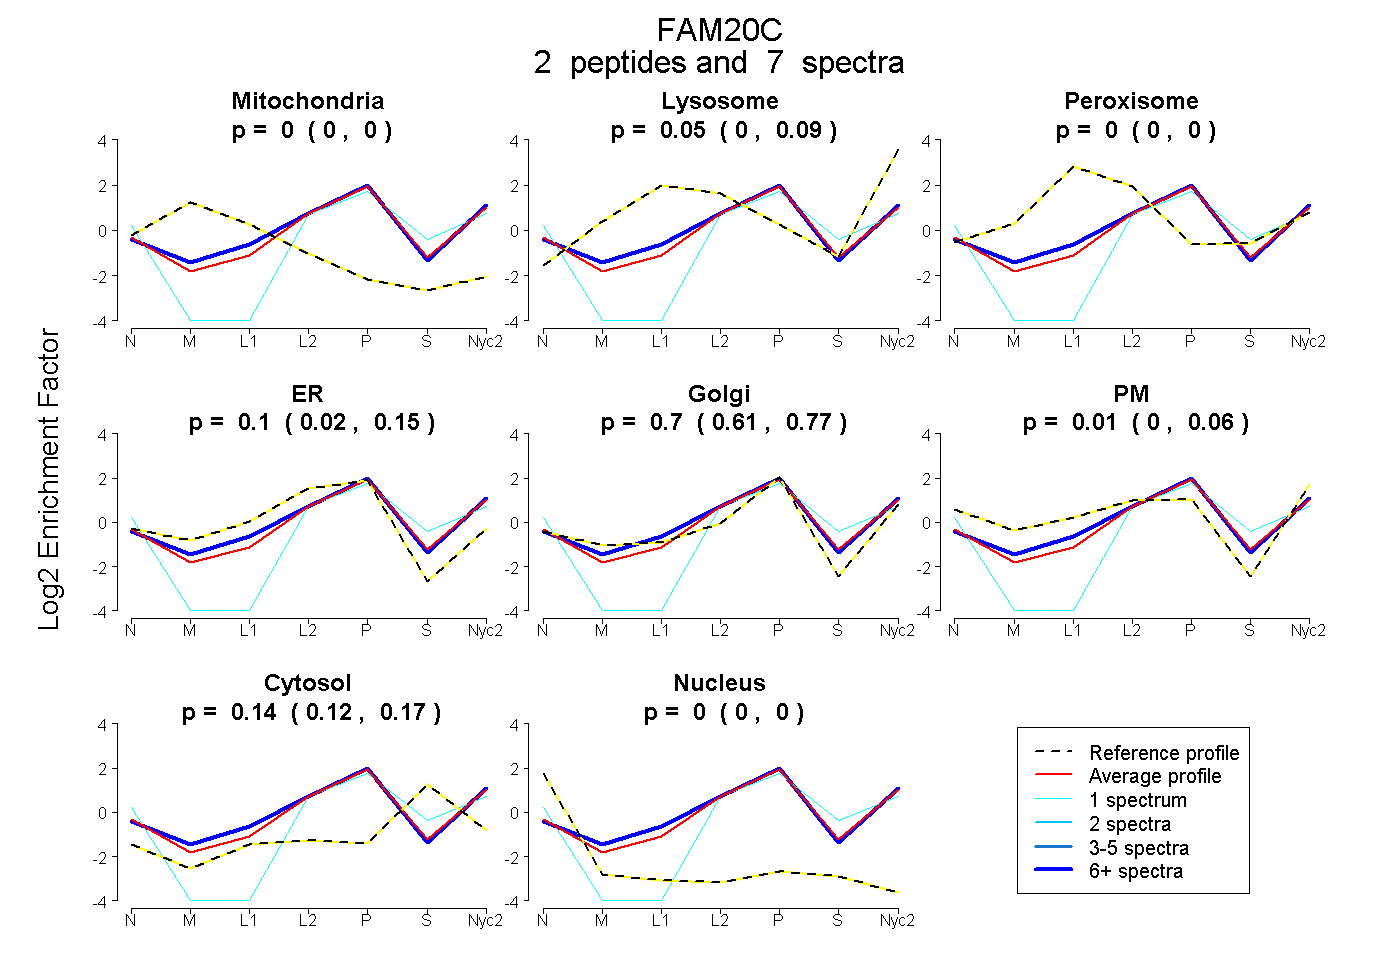
| Plot | Mito | Lyso | Perox | ER | Golgi | PM | Cytosol | Nucleus | |||||
| Expt A |
2 peptides |
7 spectra |
|
0.000 0.000 | 0.000 |
0.046 0.000 | 0.085 |
0.000 0.000 | 0.000 |
0.097 0.024 | 0.152 |
0.697 0.609 | 0.772 |
0.015 0.000 | 0.058 |
0.145 0.116 | 0.169 |
0.000 0.000 | 0.000 |
| 6 spectra, FHIGINR | 0.000 | 0.120 | 0.000 | 0.155 | 0.625 | 0.000 | 0.100 | 0.000 | ||
| 1 spectrum, HNPAIDALLHDLGSQK | 0.000 | 0.000 | 0.000 | 0.000 | 0.594 | 0.000 | 0.383 | 0.023 |
| Plot | Mito | Lyso or Perox | ER | Golgi | PM | Cytosol | Nucleus | ||||||
| Expt B |
2 peptides |
5 spectra |
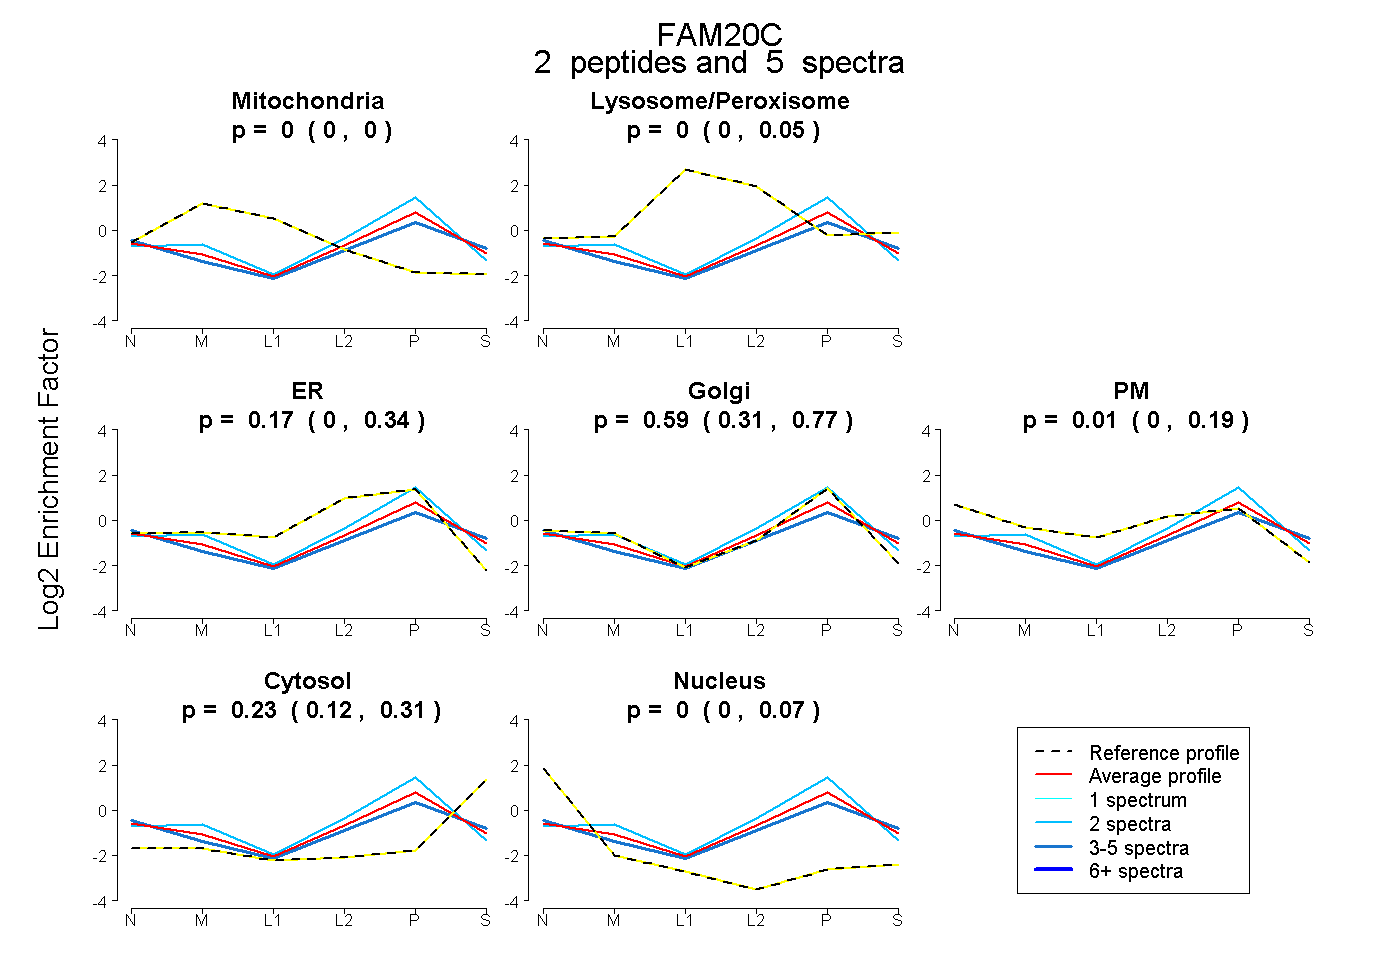 |
0.000 0.000 | 0.000 |
0.000 0.000 | 0.049 |
0.166 0.000 | 0.343 |
0.592 0.306 | 0.767 |
0.009 0.000 | 0.191 |
0.233 0.123 | 0.311 |
0.000 0.000 | 0.067 |
|||
| Plot | Lyso | Other | |||||||||||
| Expt C |
4 peptides |
6 spectra |
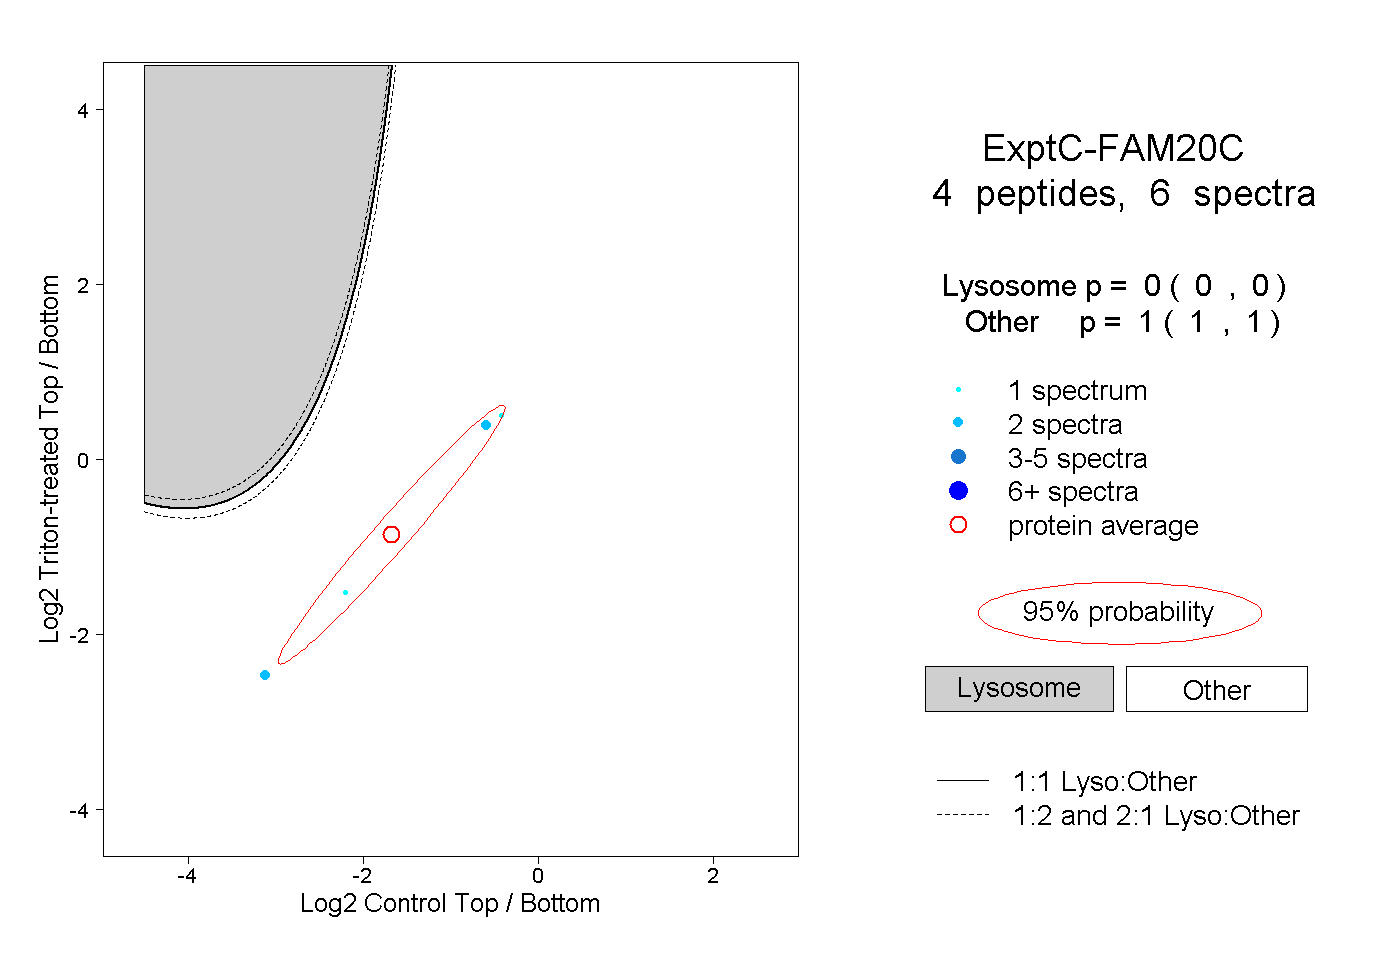 |
0.000 0.000 | 0.000 |
1.000 1.000 | 1.000 |