 8
8peptides
spectra
0.000 | 0.000
0.476 | 0.517
0.000 | 0.000
0.000 | 0.000
0.002 | 0.059
0.331 | 0.398
0.083 | 0.113
0.000 | 0.000
| Plot | Mito | Lyso | Perox | ER | Golgi | PM | Cytosol | Nucleus | |||||
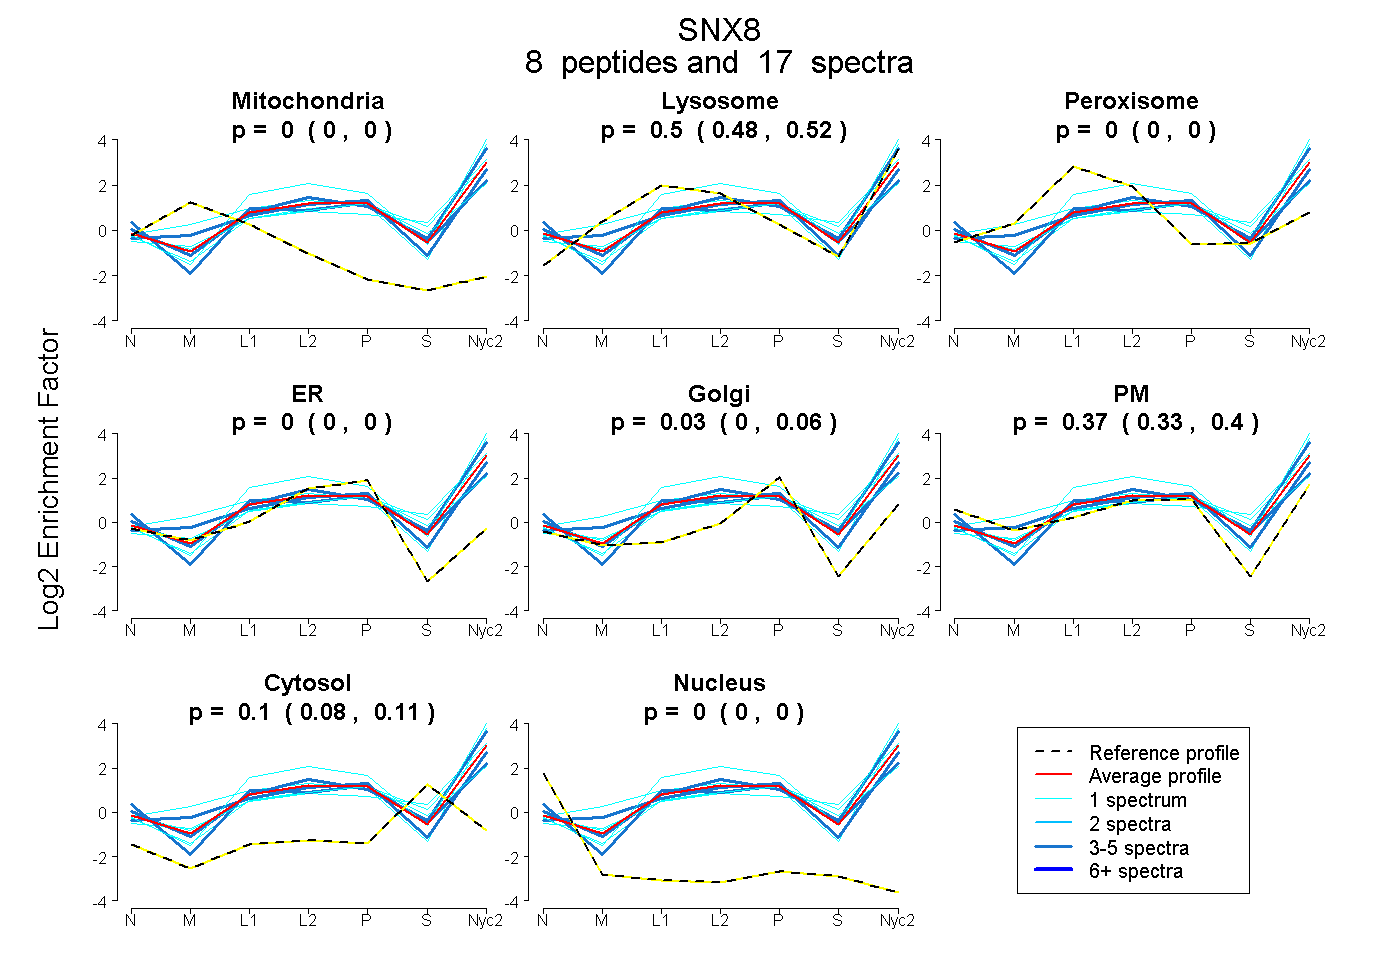
| Expt A |
8 peptides |
17 spectra |
|
0.000 0.000 | 0.000 |
0.499 0.476 | 0.517 |
0.000 0.000 | 0.000 |
0.000 0.000 | 0.000 |
0.034 0.002 | 0.059 |
0.367 0.331 | 0.398 |
0.100 0.083 | 0.113 |
0.000 0.000 | 0.000 |
| 1 spectrum, DTVQVELIPEK | 0.000 | 0.626 | 0.000 | 0.000 | 0.000 | 0.134 | 0.240 | 0.000 | ||
| 5 spectra, HPPFSEDVLLK | 0.000 | 0.493 | 0.000 | 0.000 | 0.217 | 0.277 | 0.012 | 0.000 | ||
| 3 spectra, EPESVEQLESR | 0.000 | 0.270 | 0.000 | 0.000 | 0.000 | 0.539 | 0.192 | 0.000 | ||
| 1 spectrum, NVYNSFYK | 0.000 | 0.710 | 0.000 | 0.000 | 0.000 | 0.290 | 0.000 | 0.000 | ||
| 4 spectra, FINLVAR | 0.000 | 0.573 | 0.000 | 0.000 | 0.000 | 0.350 | 0.077 | 0.000 | ||
| 1 spectrum, VWNDLKPK | 0.000 | 0.398 | 0.000 | 0.000 | 0.083 | 0.313 | 0.207 | 0.000 | ||
| 1 spectrum, EFIEGR | 0.000 | 0.631 | 0.000 | 0.000 | 0.000 | 0.369 | 0.000 | 0.000 | ||
| 1 spectrum, AIDNAADLLIFGK | 0.000 | 0.516 | 0.000 | 0.000 | 0.080 | 0.194 | 0.210 | 0.000 |
| Plot | Mito | Lyso or Perox | ER | Golgi | PM | Cytosol | Nucleus | ||||||
| Expt B |
1 peptide |
2 spectra |
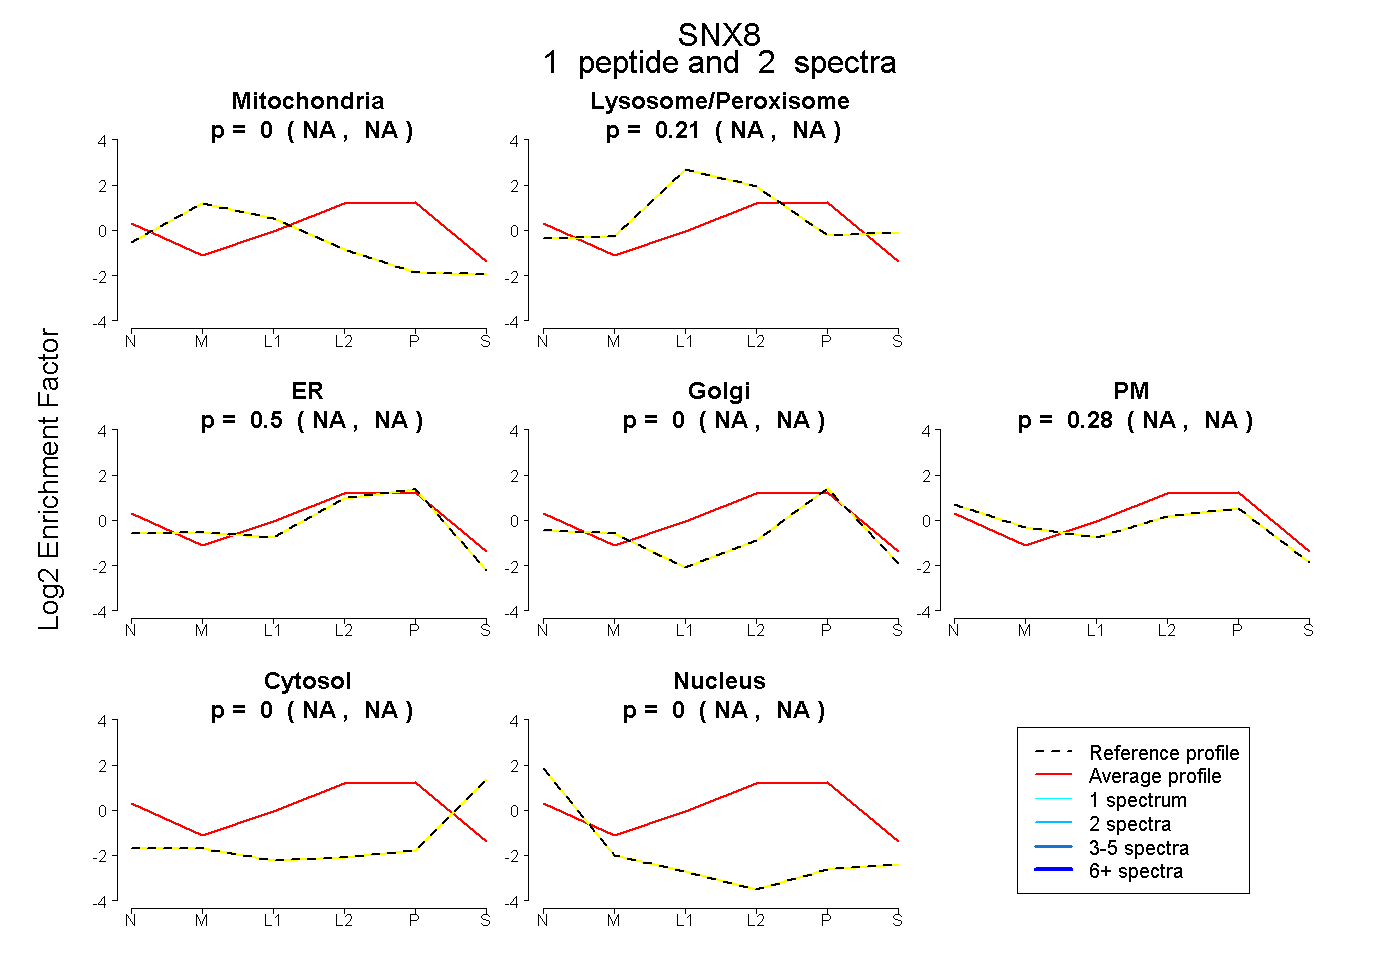 |
0.000 NA | NA |
0.211 NA | NA |
0.505 NA | NA |
0.000 NA | NA |
0.284 NA | NA |
0.000 NA | NA |
0.000 NA | NA |
|||
| Plot | Lyso | Other | |||||||||||
| Expt C |
9 peptides |
41 spectra |
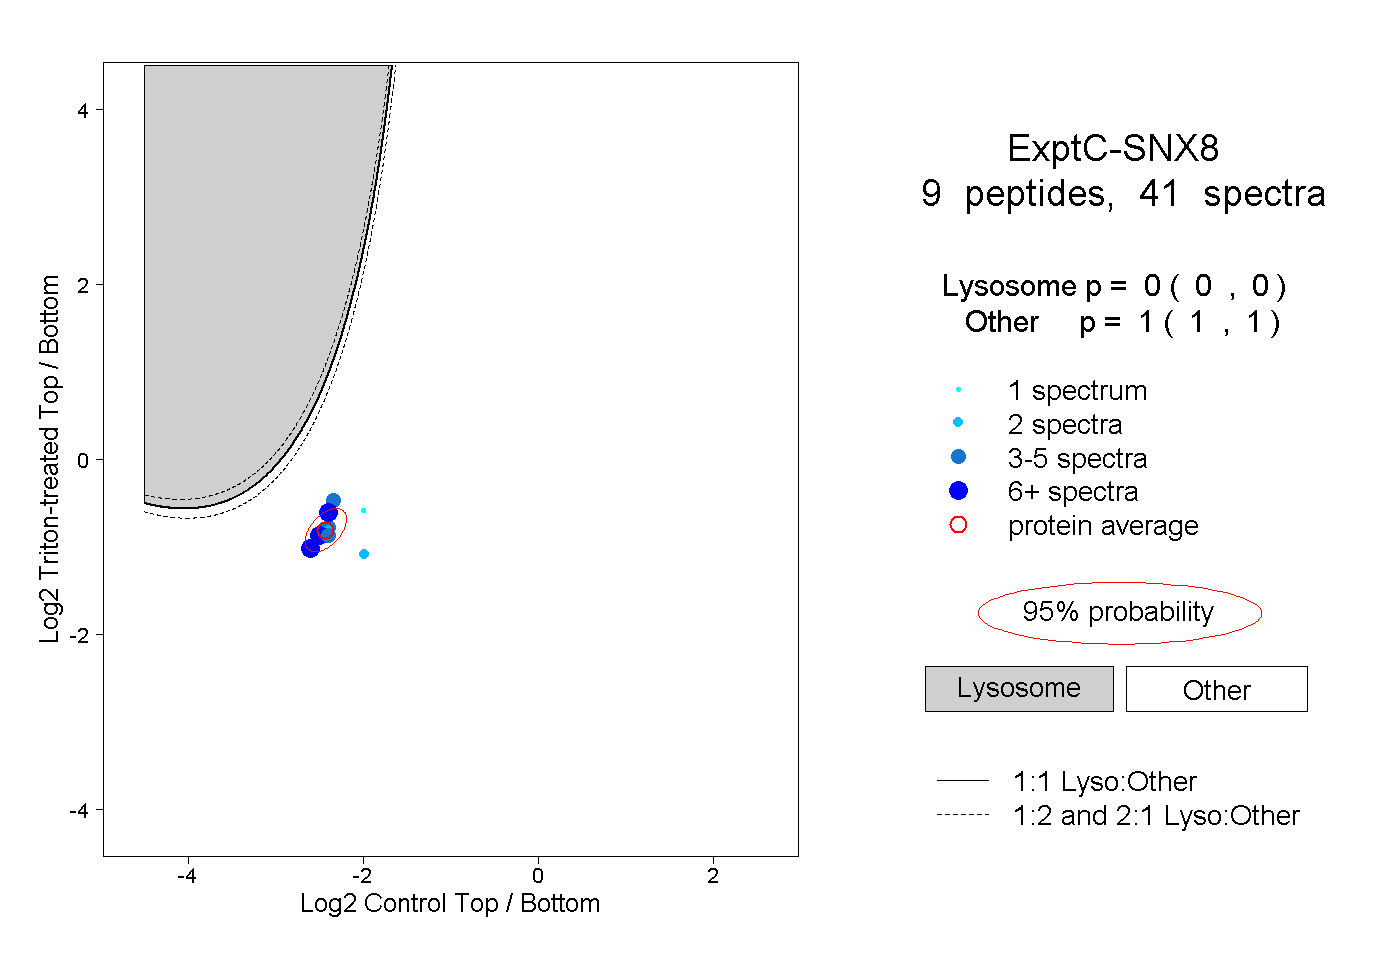 |
0.000 0.000 | 0.000 |
1.000 1.000 | 1.000 |
||||||||
| Plot | Lyso | Other | |||||||||||
| Expt D |
2 peptides |
2 spectra |
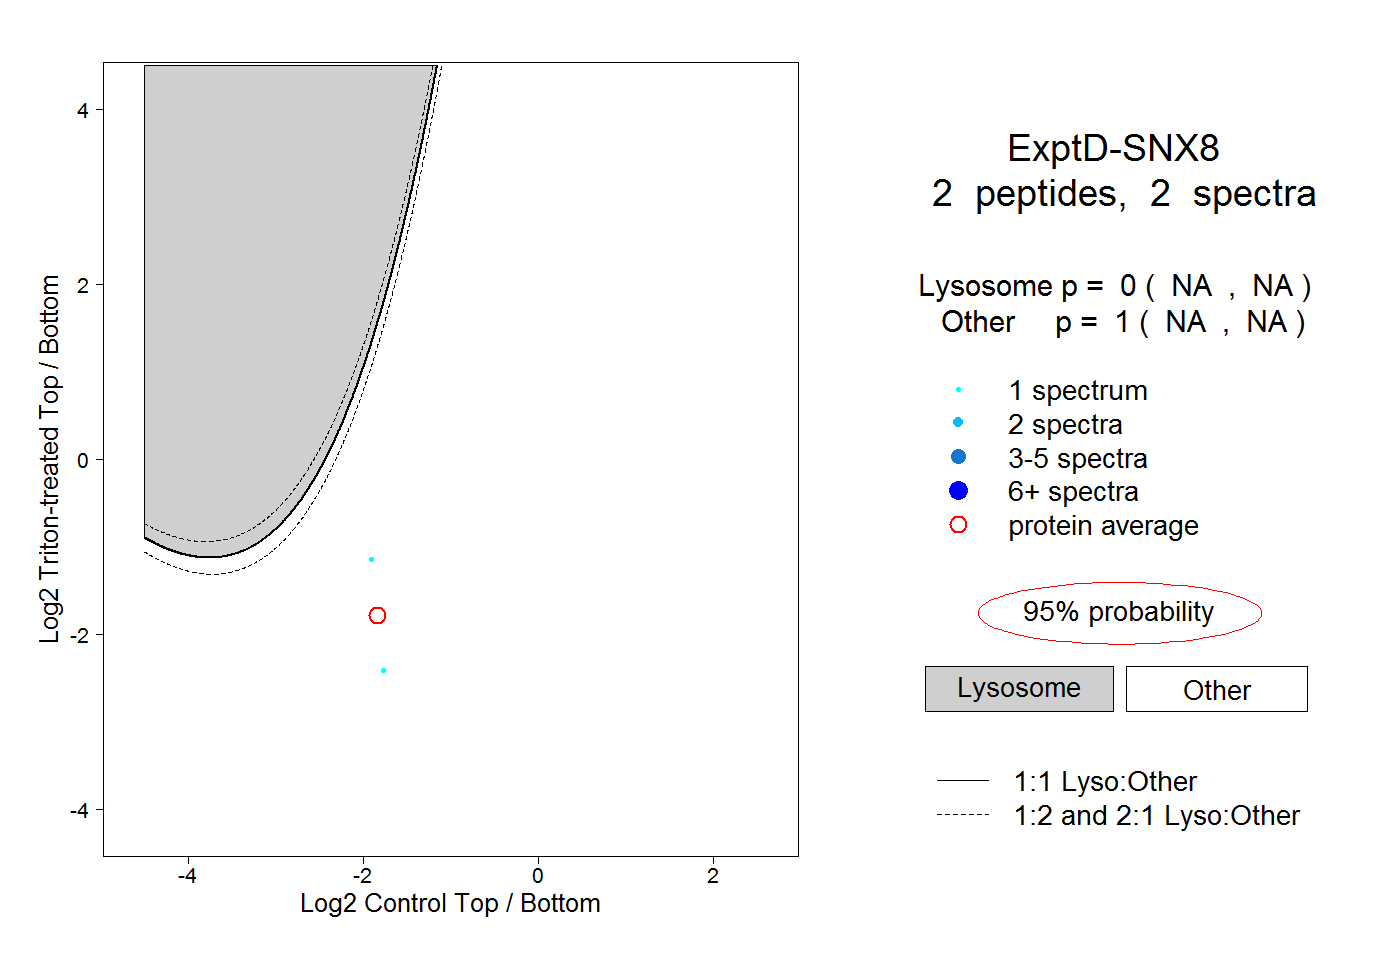 |
0.000 NA | NA |
1.000 NA | NA |