 12
12peptides
spectra
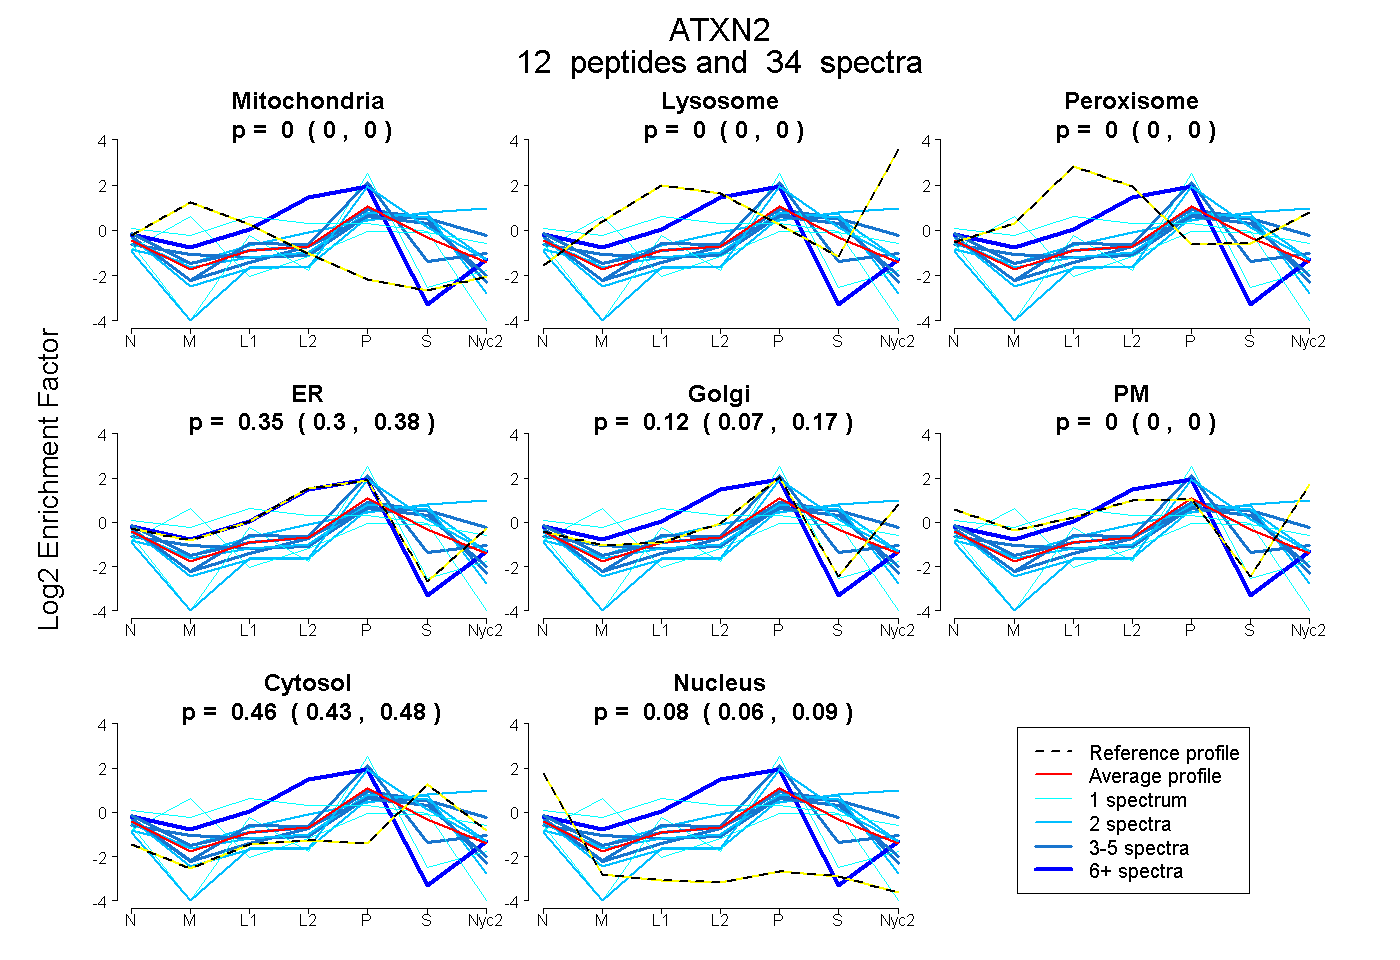
0.000 | 0.000
0.000 | 0.000
0.000 | 0.000
0.299 | 0.382
0.073 | 0.166
0.000 | 0.000
0.433 | 0.477
0.061 | 0.088
5peptides
spectra
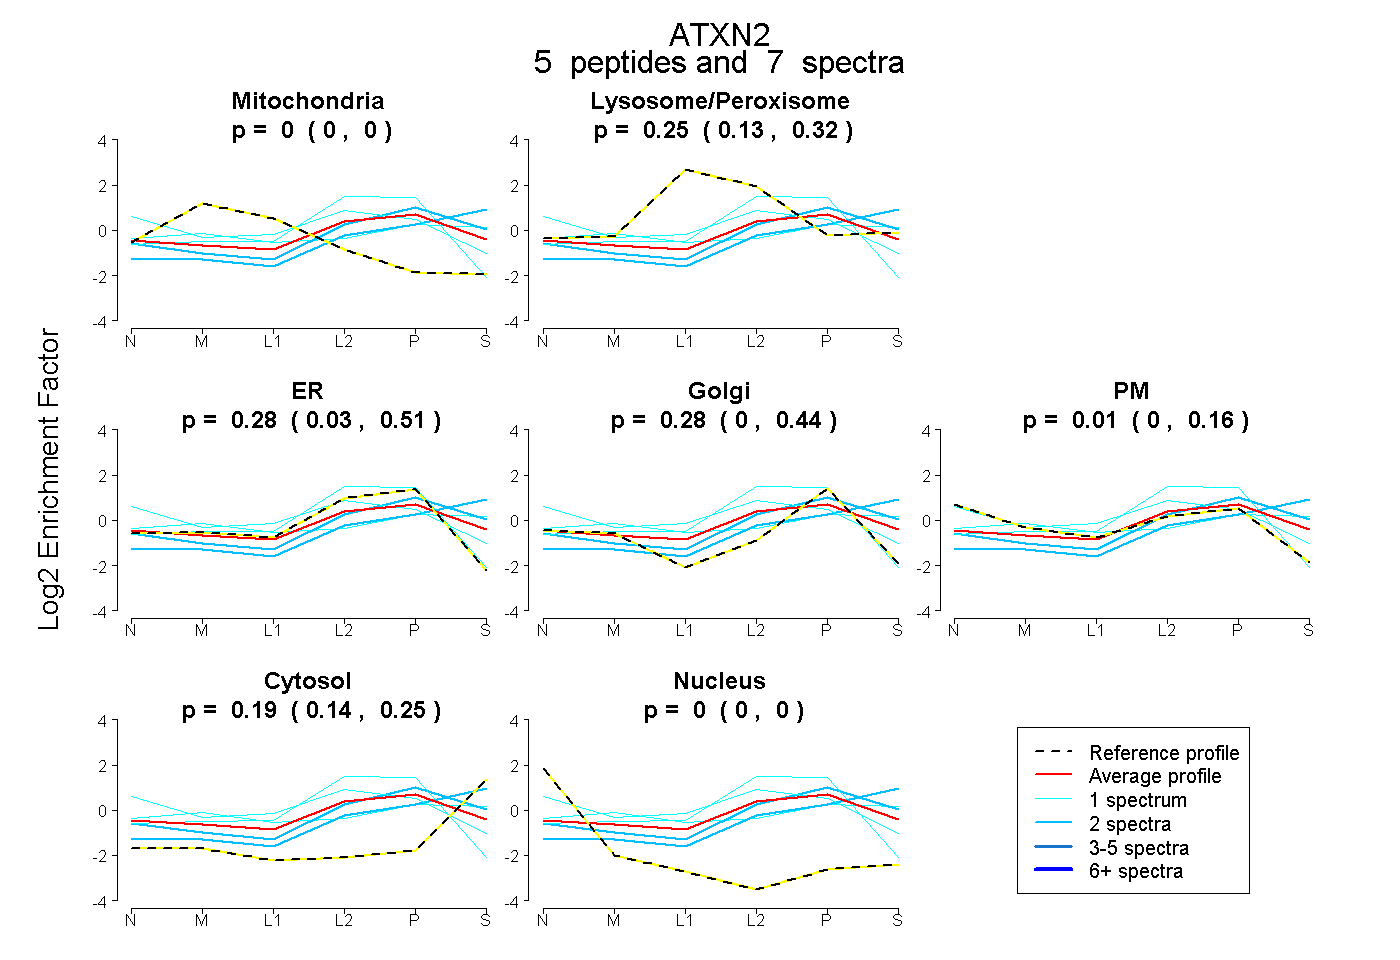
0.000 | 0.000
0.131 | 0.316
0.030 | 0.506
0.000 | 0.442
0.000 | 0.160
0.137 | 0.254
0.000 | 0.000
2peptides
spectra
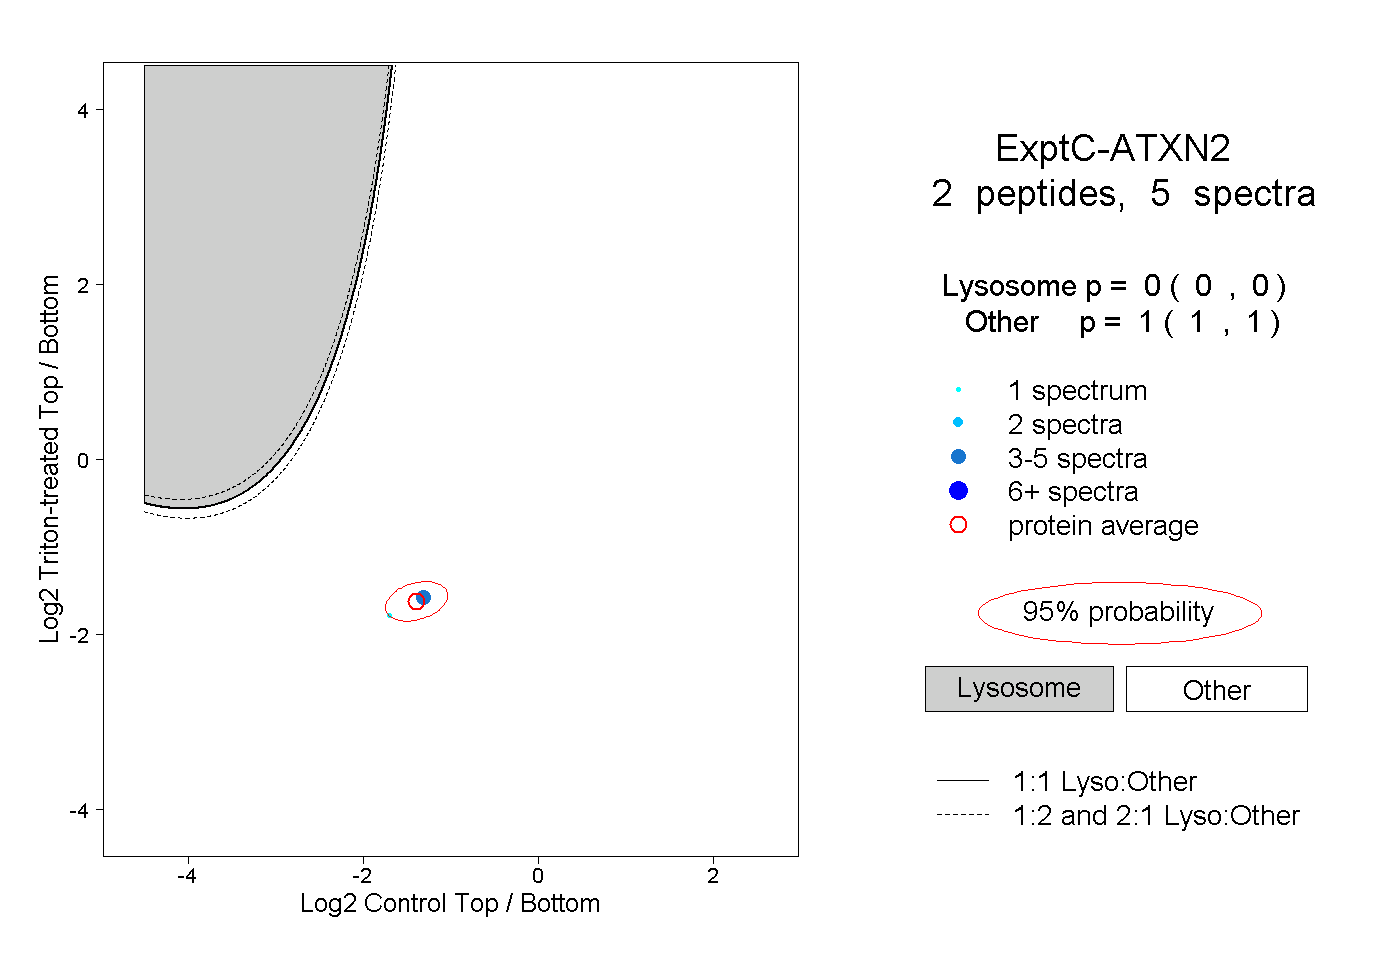
0.000 | 0.000
1.000 | 1.000