 12
12peptides
spectra
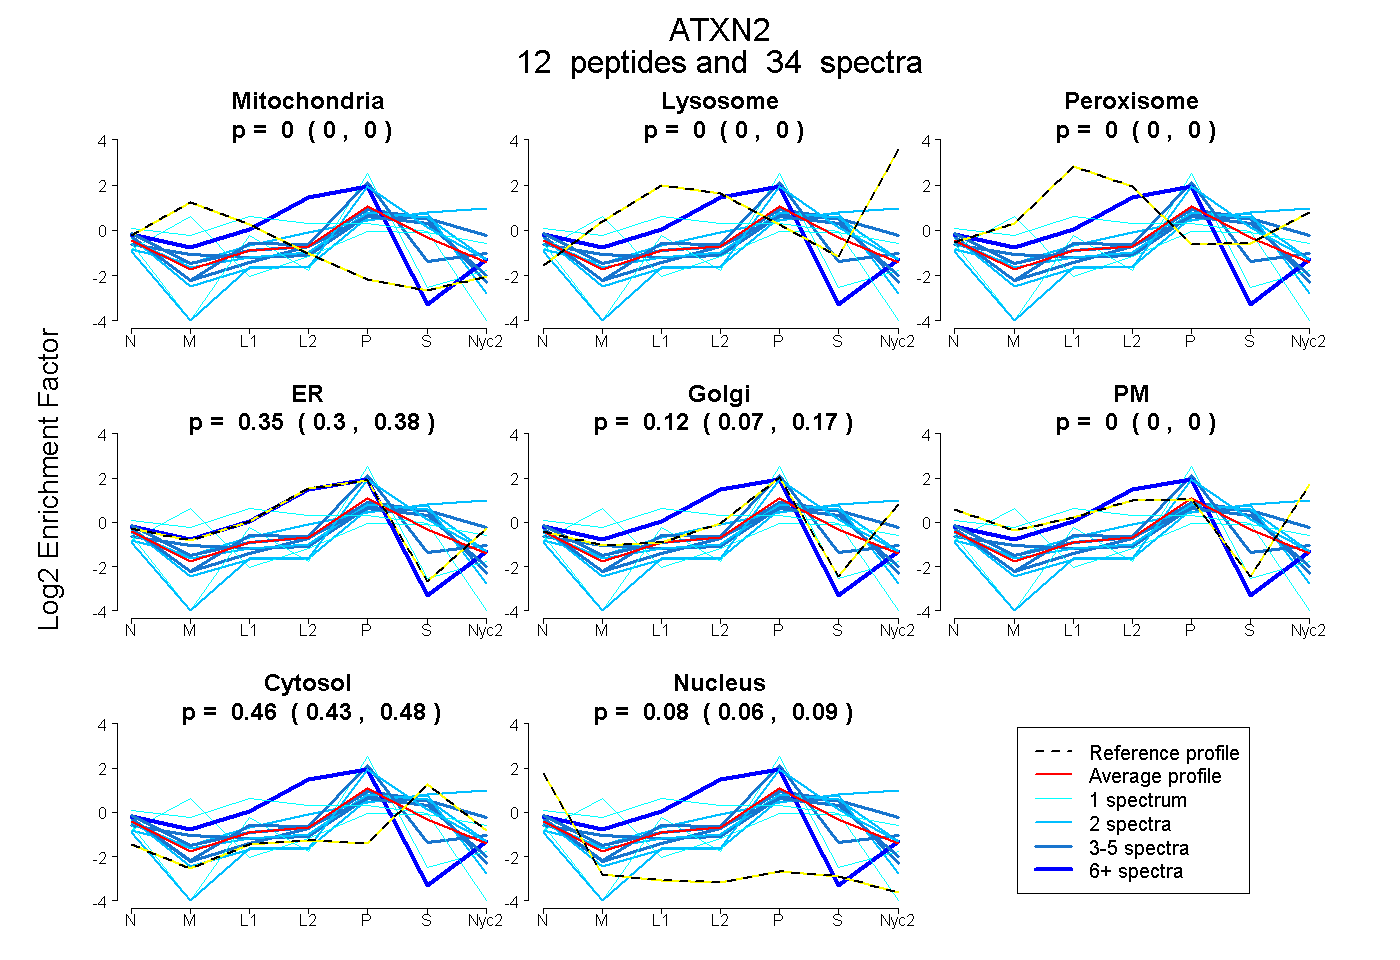
0.000 | 0.000
0.000 | 0.000
0.000 | 0.000
0.299 | 0.382
0.073 | 0.166
0.000 | 0.000
0.433 | 0.477
0.061 | 0.088
| Plot | Mito | Lyso | Perox | ER | Golgi | PM | Cytosol | Nucleus | |||||
| Expt A |
12 peptides |
34 spectra |
|
0.000 0.000 | 0.000 |
0.000 0.000 | 0.000 |
0.000 0.000 | 0.000 |
0.346 0.299 | 0.382 |
0.122 0.073 | 0.166 |
0.000 0.000 | 0.000 |
0.457 0.433 | 0.477 |
0.075 0.061 | 0.088 |
| 1 spectrum, MGQPGPGSMPSR | 0.000 | 0.000 | 0.000 | 0.089 | 0.598 | 0.000 | 0.052 | 0.261 | ||
| 4 spectra, CDLVLDAAHEK | 0.000 | 0.000 | 0.000 | 0.303 | 0.000 | 0.000 | 0.581 | 0.115 | ||
| 1 spectrum, TSPAGGTWSSVVSGVPR | 0.377 | 0.000 | 0.050 | 0.283 | 0.000 | 0.000 | 0.263 | 0.027 | ||
| 1 spectrum, MVHILTSVVGSK | 0.284 | 0.000 | 0.000 | 0.000 | 0.300 | 0.000 | 0.416 | 0.000 | ||
| 2 spectra, STLNPNAK | 0.000 | 0.000 | 0.000 | 0.000 | 0.369 | 0.000 | 0.571 | 0.060 | ||
| 4 spectra, DNSEEFLK | 0.000 | 0.000 | 0.016 | 0.000 | 0.417 | 0.000 | 0.567 | 0.000 | ||
| 2 spectra, EEIMESVLFK | 0.000 | 0.000 | 0.000 | 0.176 | 0.176 | 0.000 | 0.621 | 0.027 | ||
| 2 spectra, CSDFVVVQFK | 0.000 | 0.257 | 0.000 | 0.000 | 0.206 | 0.000 | 0.537 | 0.000 | ||
| 2 spectra, DTDSSYAR | 0.000 | 0.000 | 0.000 | 0.153 | 0.000 | 0.000 | 0.643 | 0.204 | ||
| 3 spectra, MSAEGPPR | 0.000 | 0.000 | 0.000 | 0.274 | 0.433 | 0.000 | 0.206 | 0.087 | ||
| 9 spectra, QLDDLK | 0.011 | 0.000 | 0.000 | 0.939 | 0.000 | 0.000 | 0.000 | 0.050 | ||
| 3 spectra, STESSSGPK | 0.000 | 0.000 | 0.000 | 0.362 | 0.000 | 0.000 | 0.538 | 0.100 |
| Plot | Mito | Lyso or Perox | ER | Golgi | PM | Cytosol | Nucleus | ||||||
| Expt B |
5 peptides |
7 spectra |
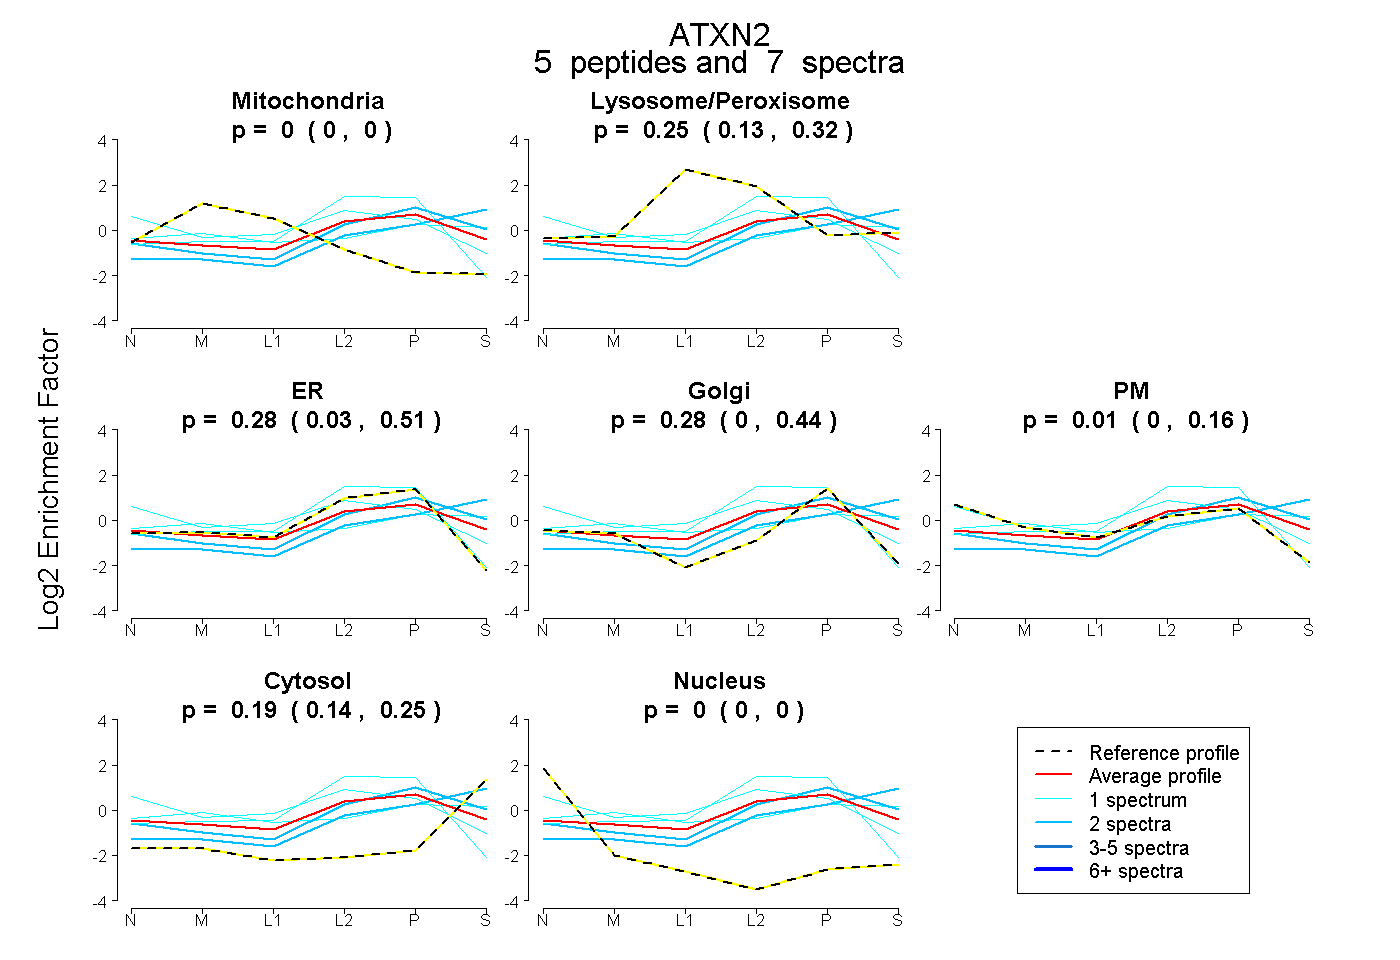 |
0.000 0.000 | 0.000 |
0.246 0.131 | 0.316 |
0.276 0.030 | 0.506 |
0.275 0.000 | 0.442 |
0.008 0.000 | 0.160 |
0.194 0.137 | 0.254 |
0.000 0.000 | 0.000 |
|||
| Plot | Lyso | Other | |||||||||||
| Expt C |
2 peptides |
5 spectra |
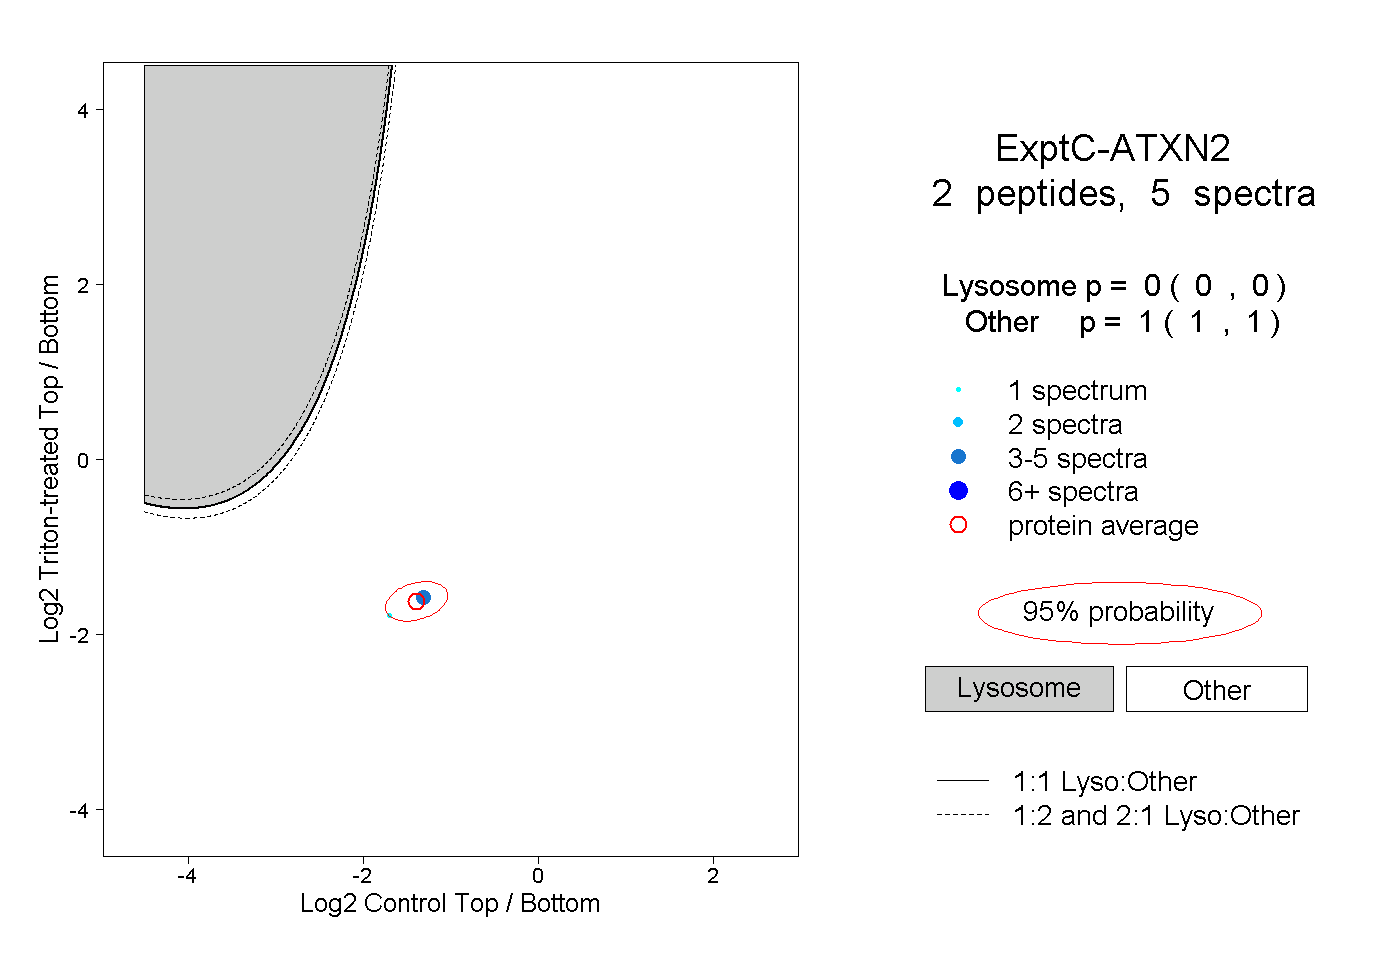 |
0.000 0.000 | 0.000 |
1.000 1.000 | 1.000 |