 13
13peptides
spectra
0.000 | 0.000
0.000 | 0.000
0.000 | 0.000
0.000 | 0.000
0.056 | 0.100
0.000 | 0.030
0.887 | 0.911
0.000 | 0.015
13peptides
spectra
0.000 | 0.000
1.000 | 1.000
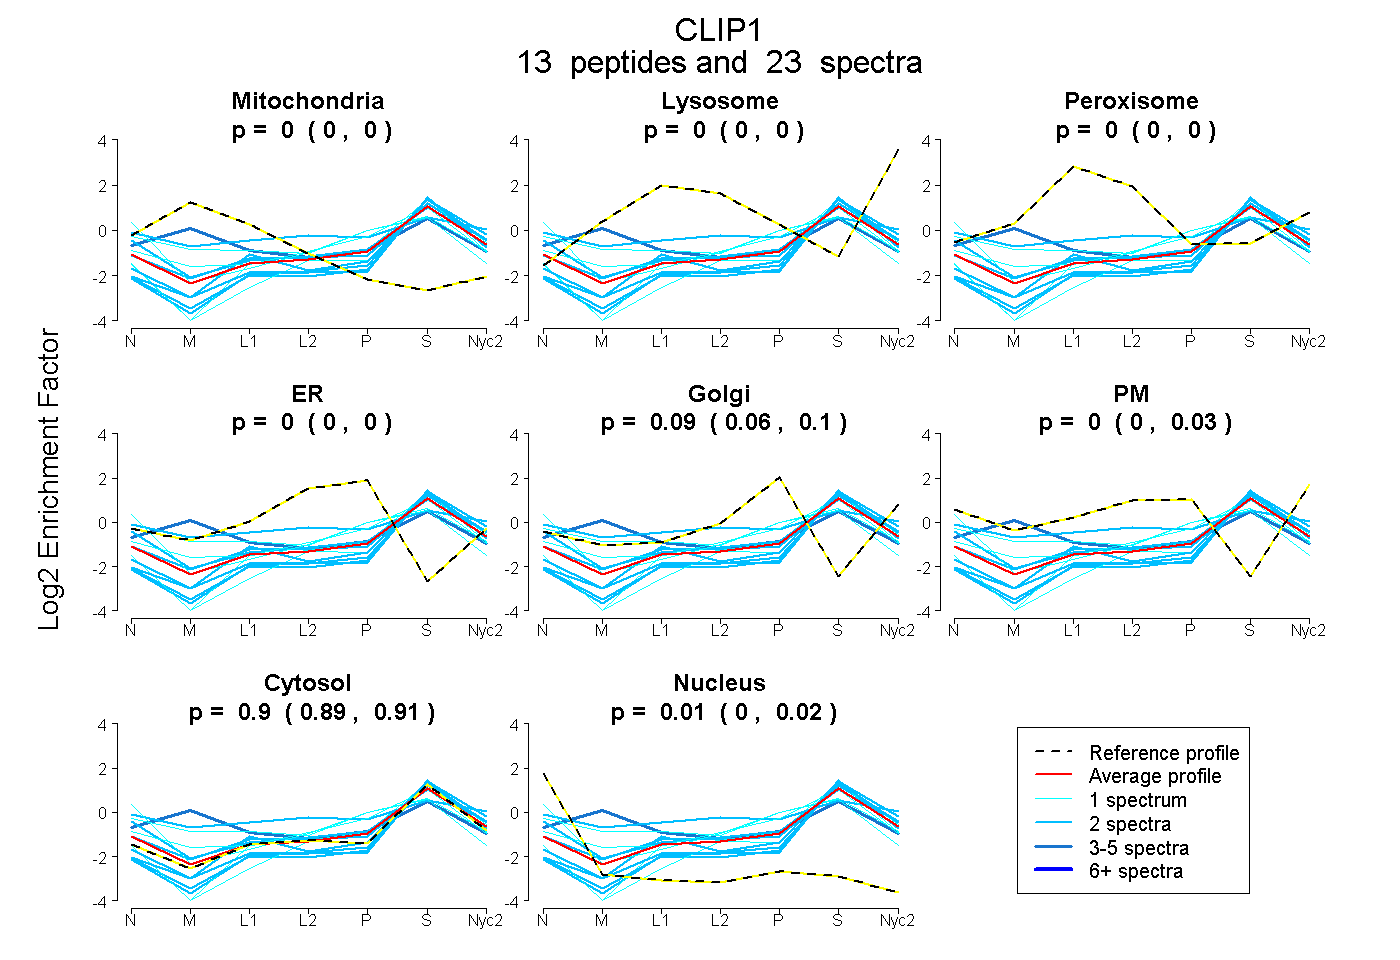
| Plot | Mito | Lyso | Perox | ER | Golgi | PM | Cytosol | Nucleus | |||||
| Expt A |
13 peptides |
23 spectra |
|
0.000 0.000 | 0.000 |
0.000 0.000 | 0.000 |
0.000 0.000 | 0.000 |
0.000 0.000 | 0.000 |
0.092 0.056 | 0.100 |
0.001 0.000 | 0.030 |
0.901 0.887 | 0.911 |
0.006 0.000 | 0.015 |
||
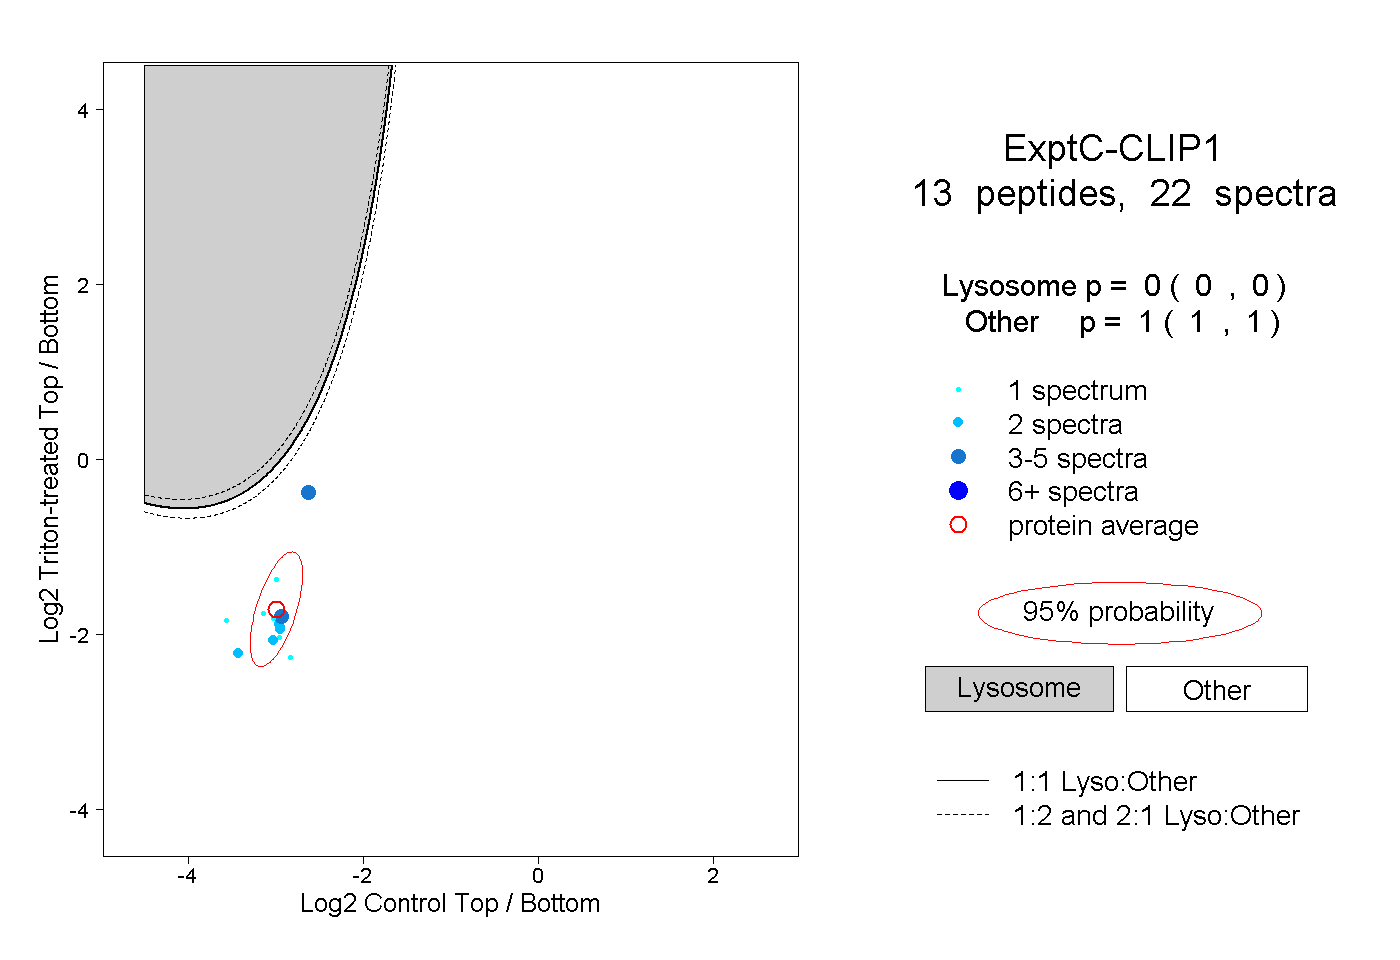
| Plot | Lyso | Other | |||||||||||
| Expt C |
13 peptides |
22 spectra |
|
0.000 0.000 | 0.000 |
1.000 1.000 | 1.000 |