 7
7peptides
spectra
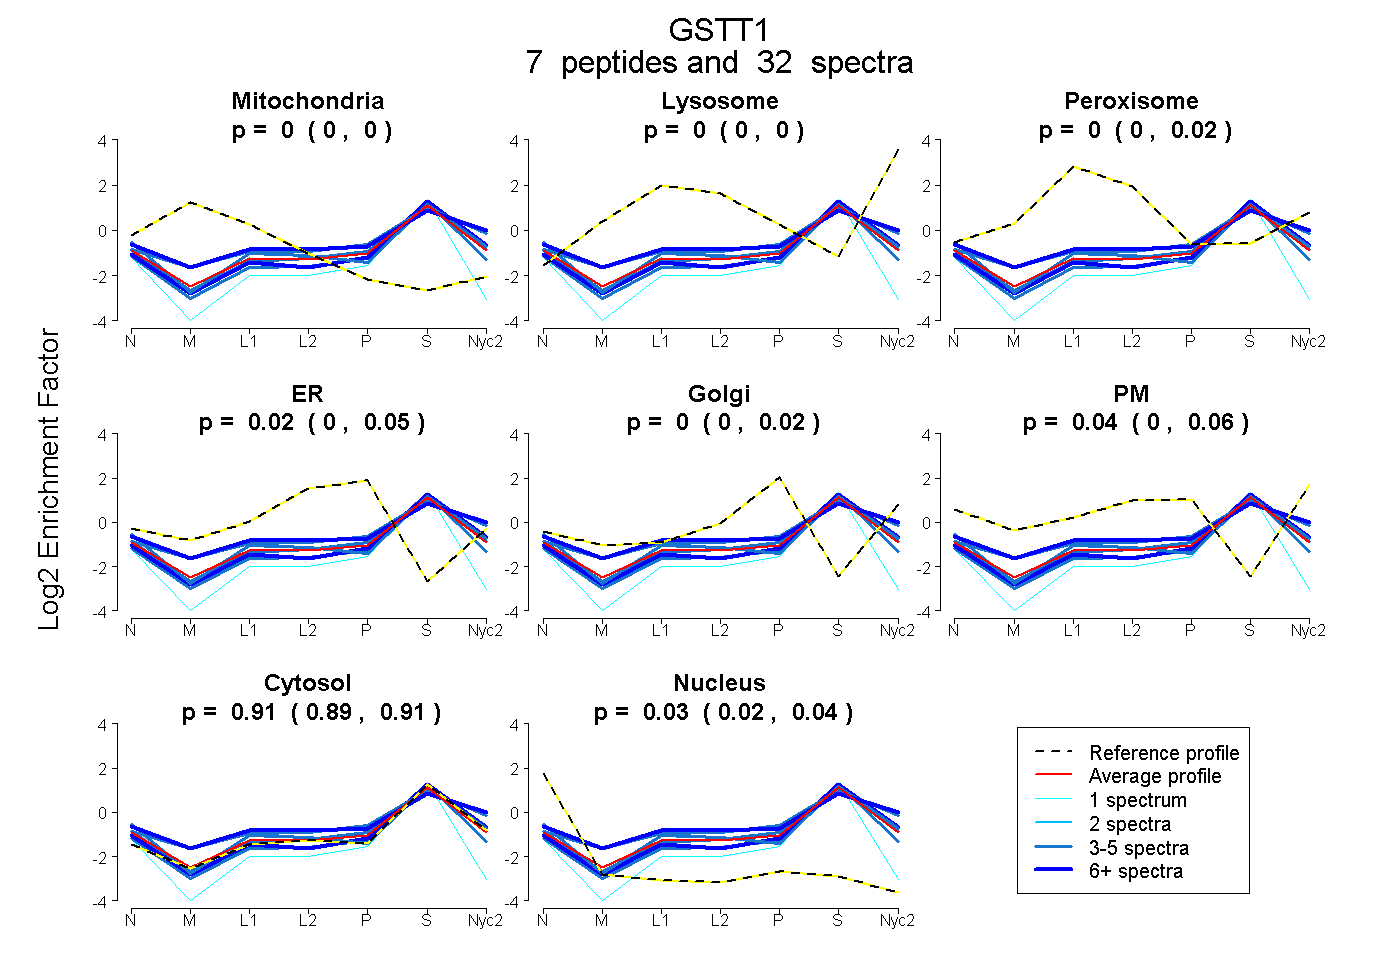
0.000 | 0.000
0.000 | 0.000
0.000 | 0.016
0.000 | 0.045
0.000 | 0.023
0.000 | 0.065
0.892 | 0.911
0.024 | 0.042
3peptides
spectra
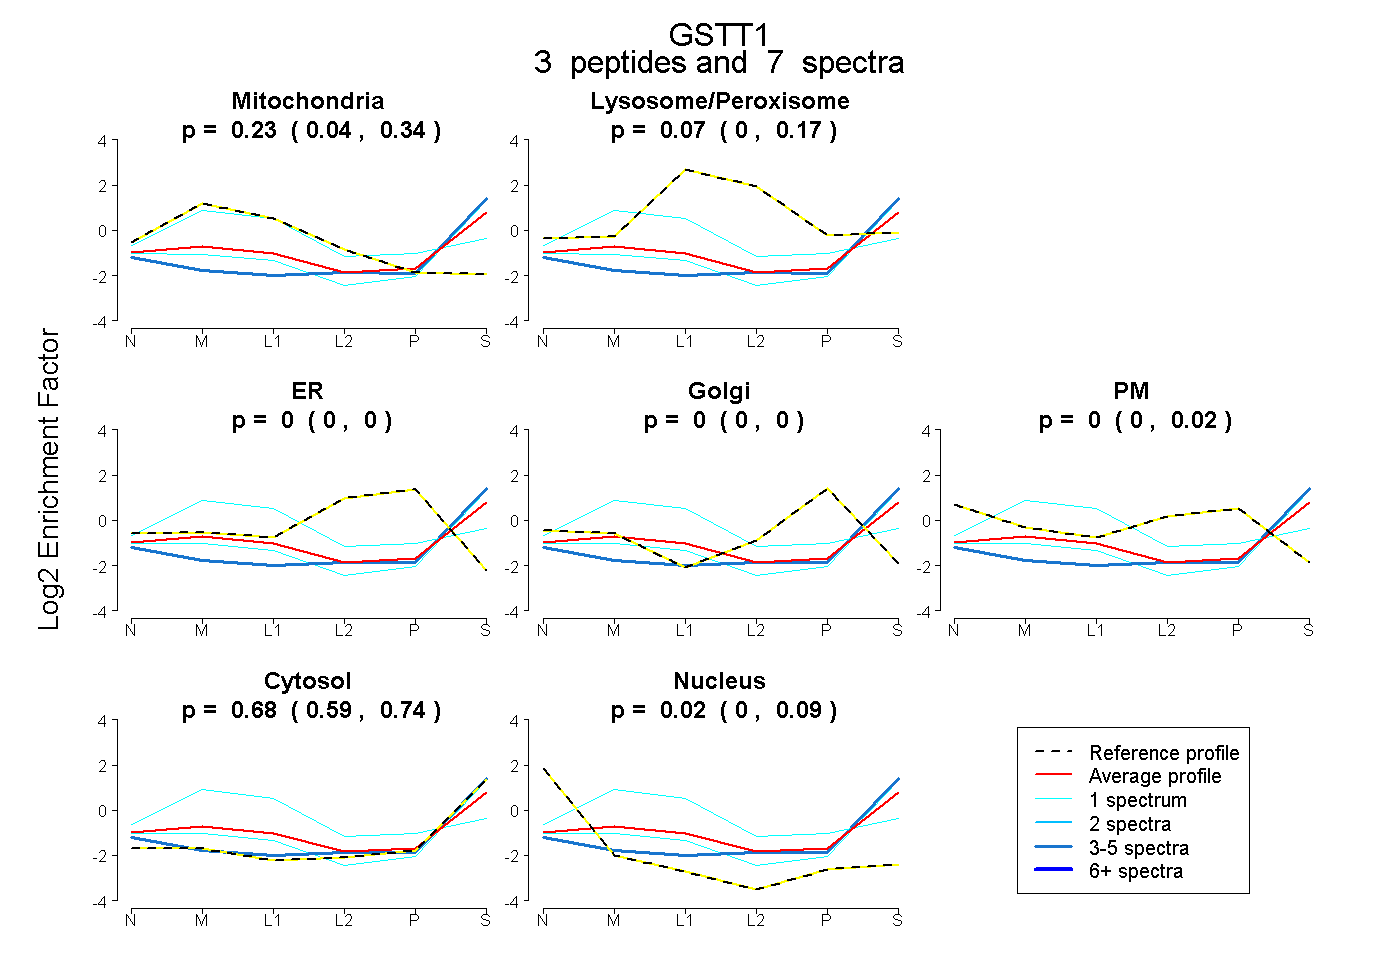
0.040 | 0.342
0.000 | 0.165
0.000 | 0.000
0.000 | 0.000
0.000 | 0.019
0.592 | 0.744
0.000 | 0.092
8peptides
spectra
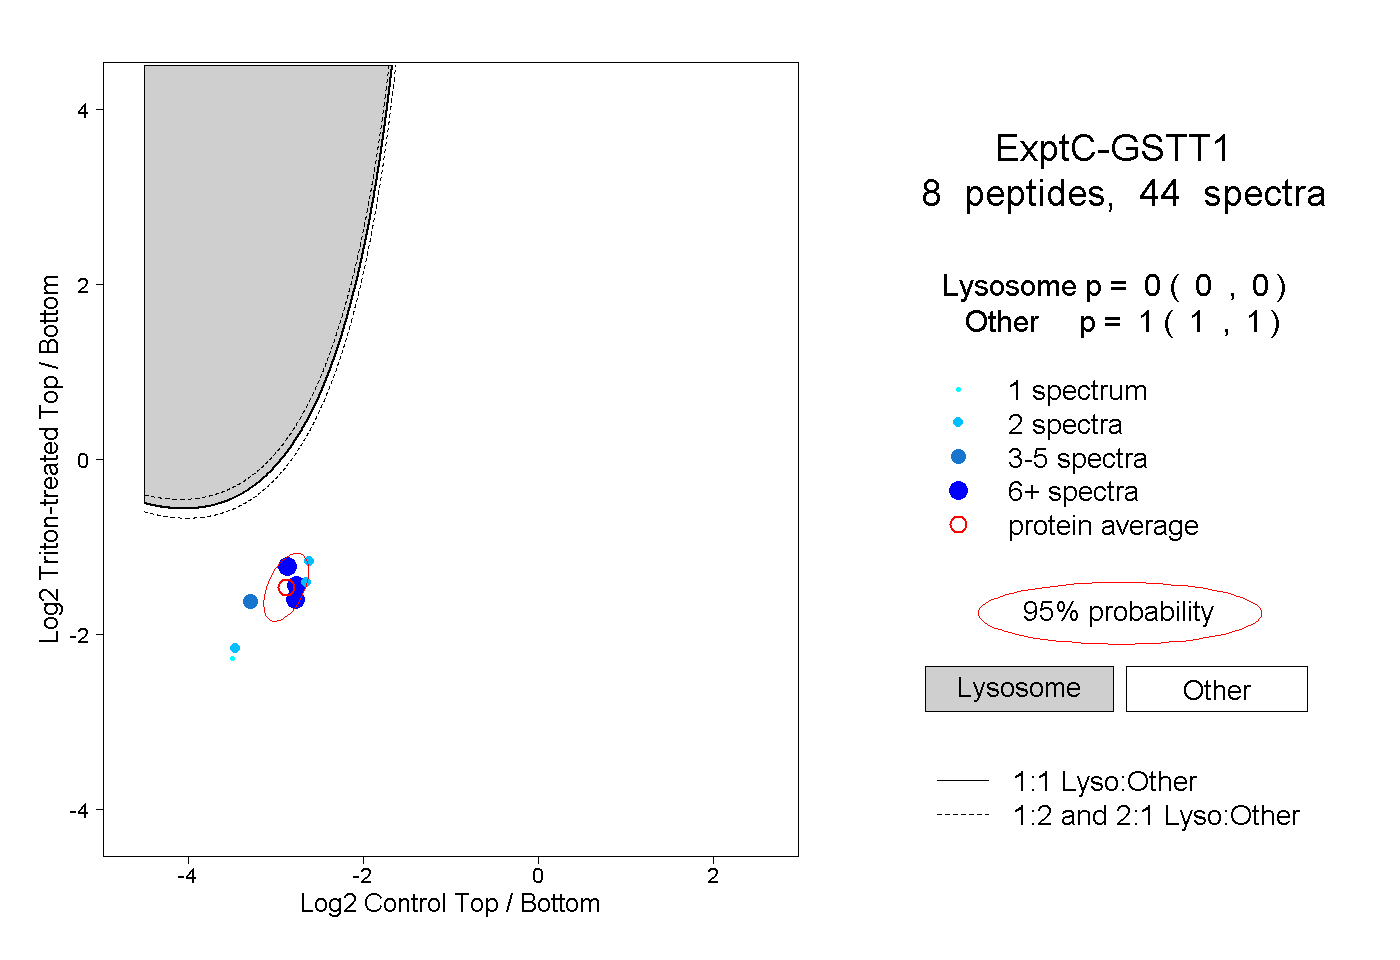
0.000 | 0.000
1.000 | 1.000
1peptide
spectrum
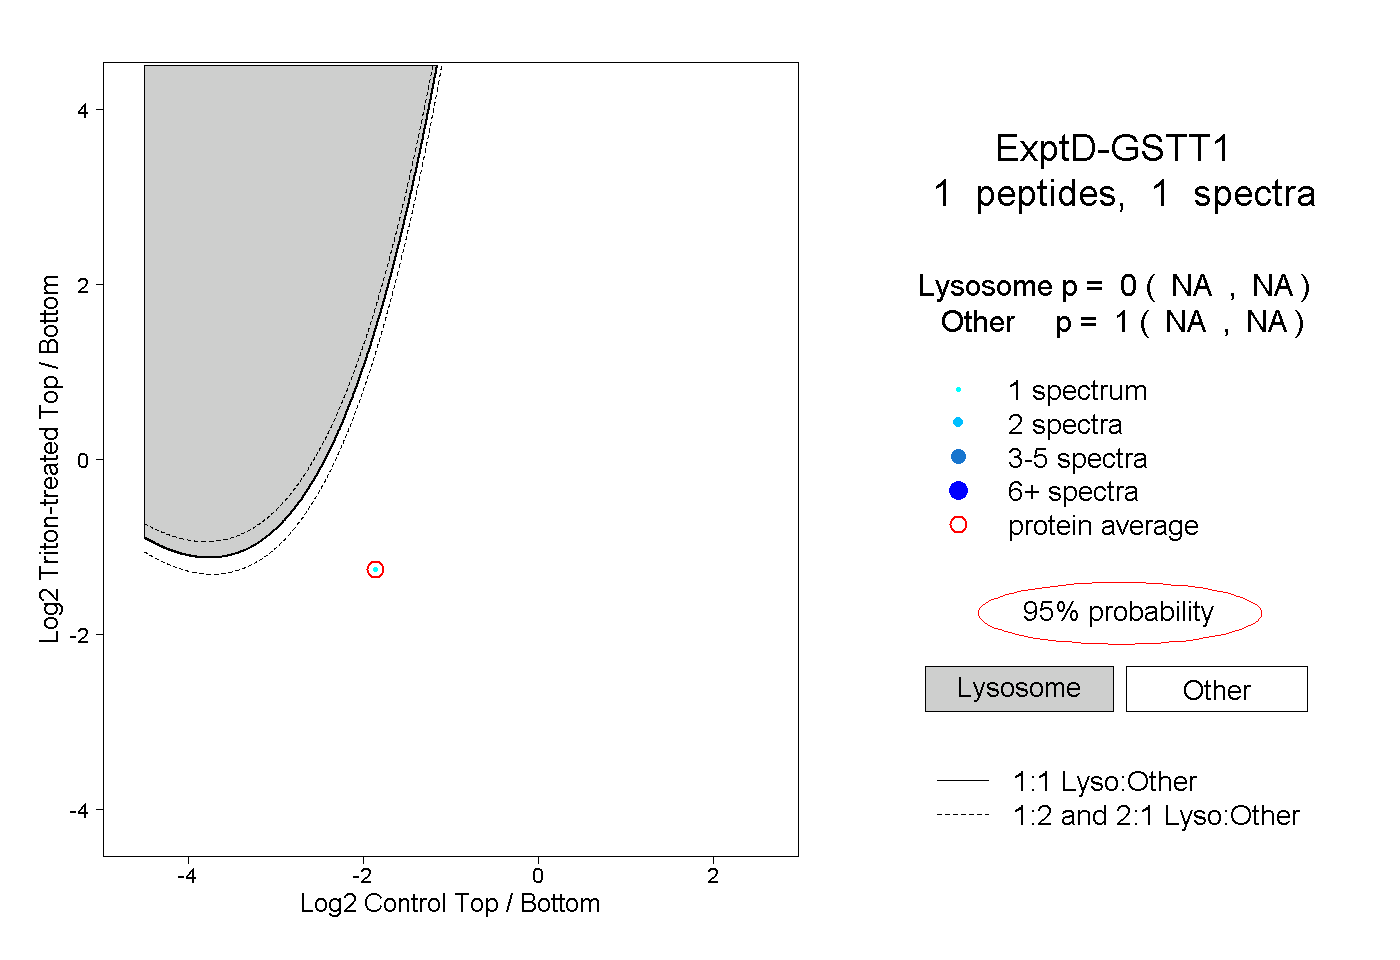
NA | NA
NA | NA