 4
4peptides
spectra
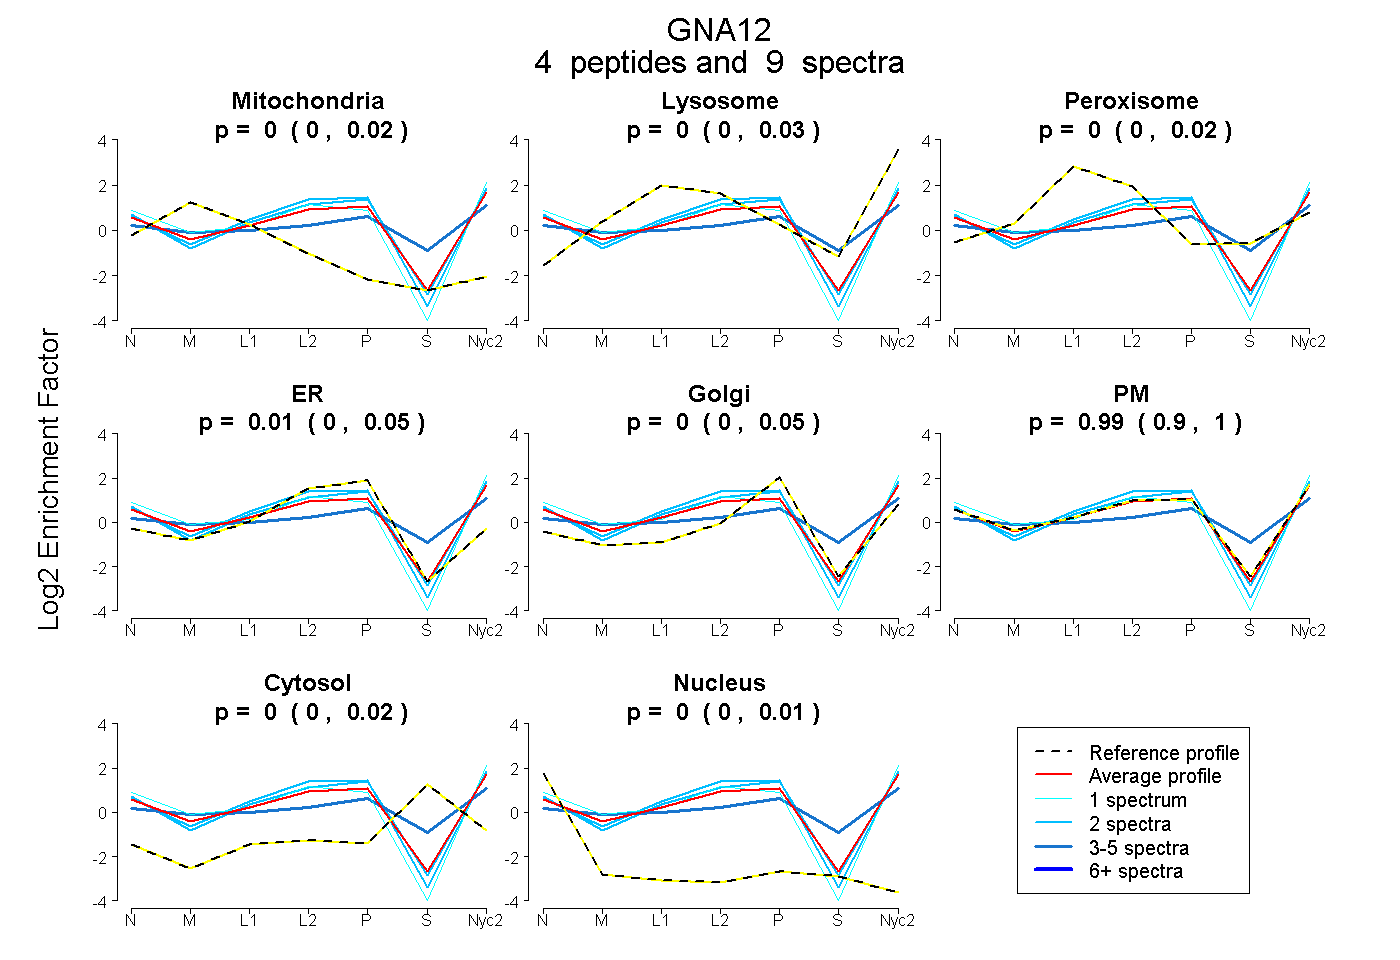
0.000 | 0.017
0.000 | 0.028
0.000 | 0.020
0.000 | 0.053
0.000 | 0.047
0.897 | 0.999
0.000 | 0.017
0.000 | 0.012
4peptides
spectra
0.000 | 0.000
1.000 | 1.000
| Plot | Mito | Lyso | Perox | ER | Golgi | PM | Cytosol | Nucleus | |||||
| Expt A |
4 peptides |
9 spectra |
|
0.000 0.000 | 0.017 |
0.000 0.000 | 0.028 |
0.000 0.000 | 0.020 |
0.008 0.000 | 0.053 |
0.001 0.000 | 0.047 |
0.988 0.897 | 0.999 |
0.000 0.000 | 0.017 |
0.002 0.000 | 0.012 |
||
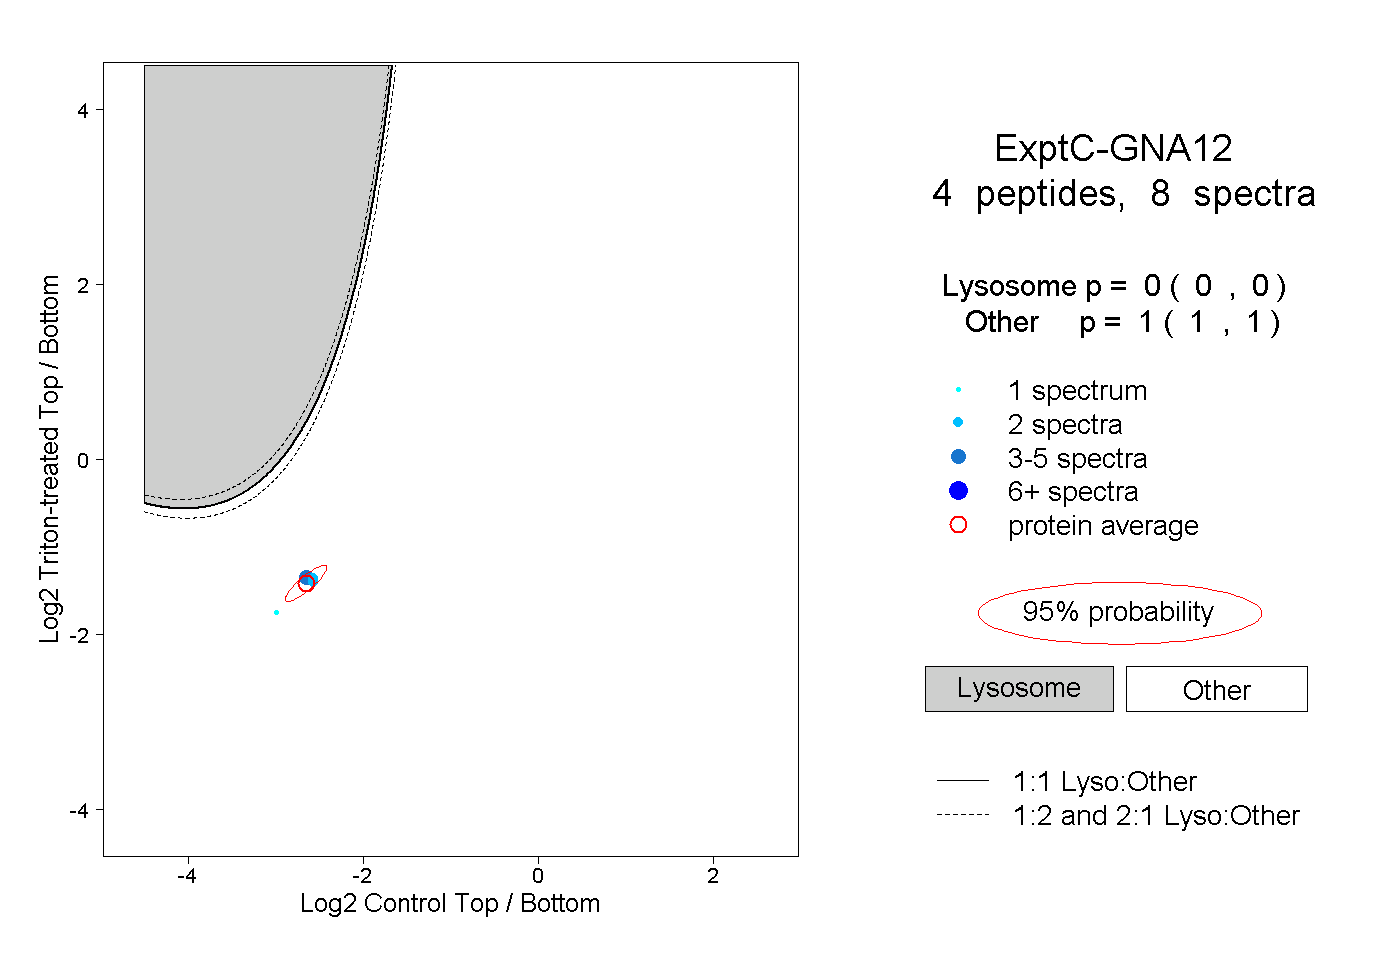
| Plot | Lyso | Other | |||||||||||
| Expt C |
4 peptides |
8 spectra |
|
0.000 0.000 | 0.000 |
1.000 1.000 | 1.000 |