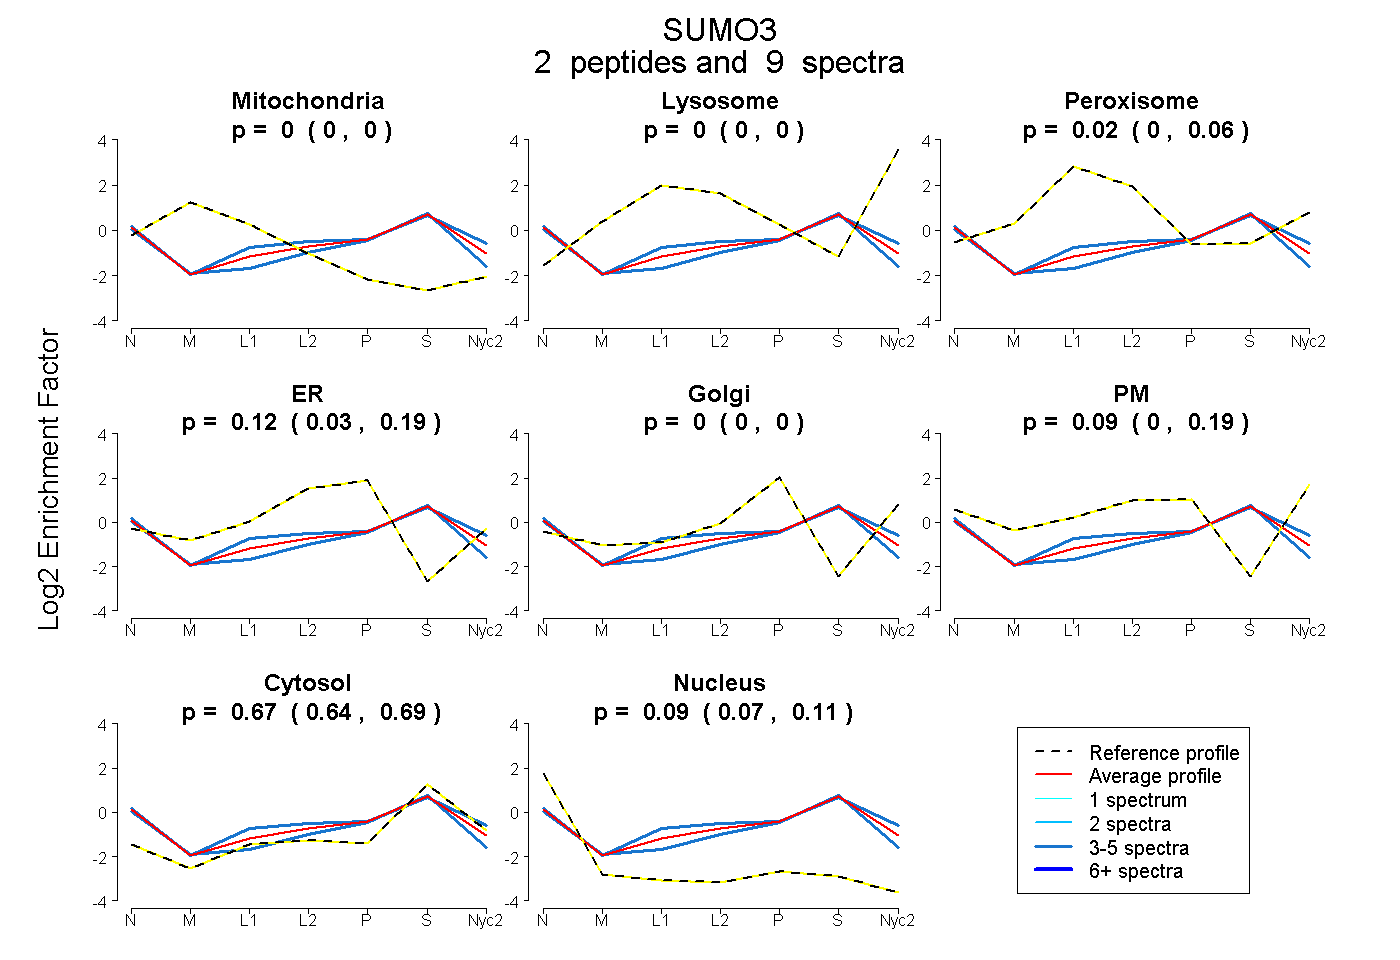
 2
2peptides
spectra
0.000 | 0.000
0.000 | 0.000
0.000 | 0.060
0.027 | 0.187
0.000 | 0.000
0.000 | 0.193
0.639 | 0.686
0.066 | 0.114
6peptides
spectra
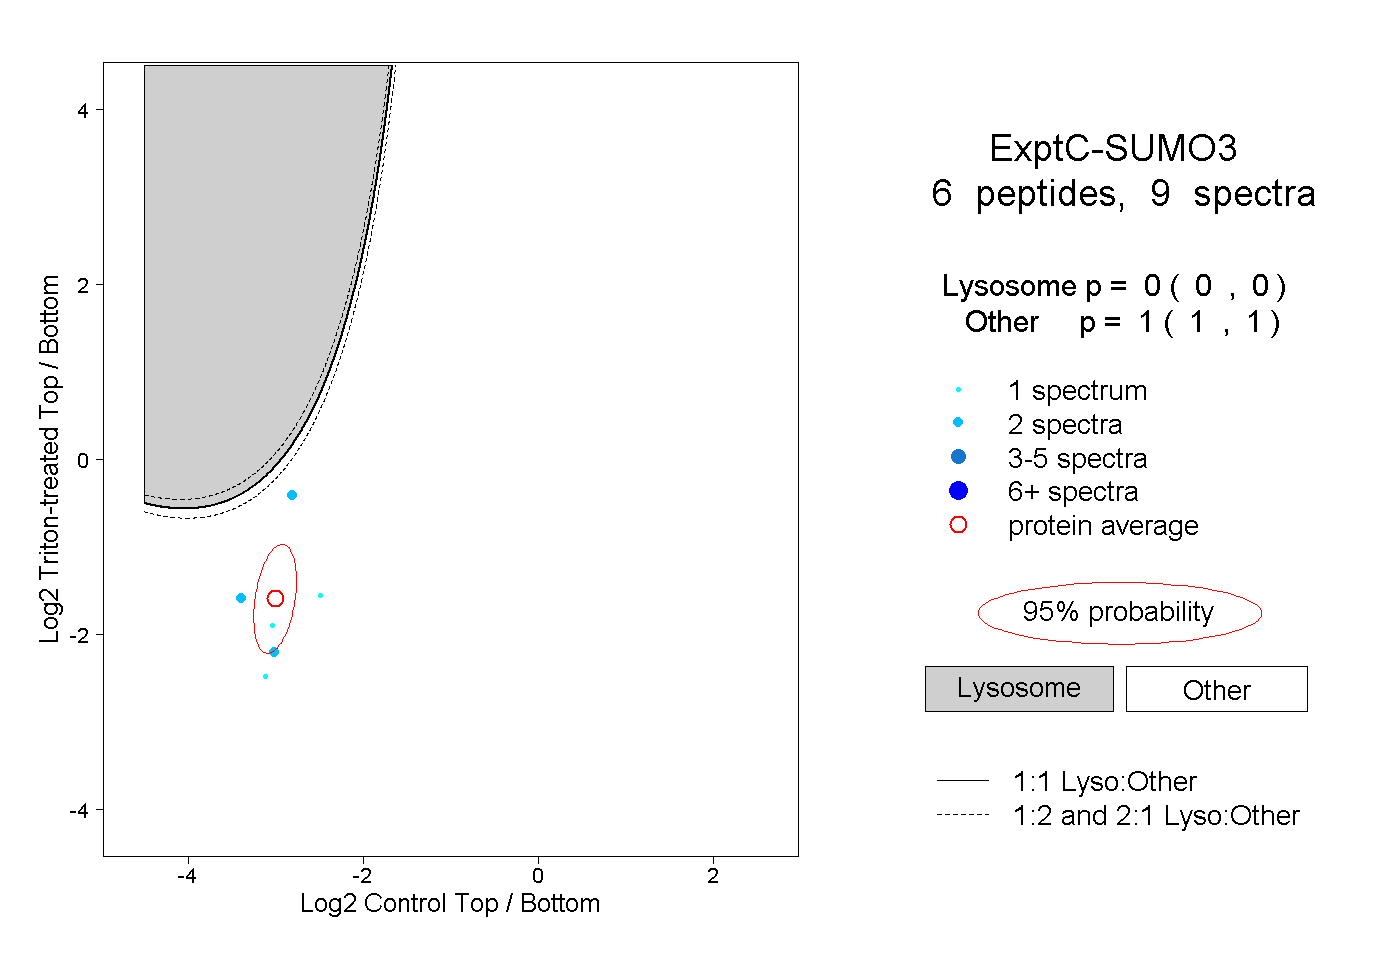
0.000 | 0.000
1.000 | 1.000
| Plot | Mito | Lyso | Perox | ER | Golgi | PM | Cytosol | Nucleus | |||||
| Expt A |
2 peptides |
9 spectra |
|
0.000 0.000 | 0.000 |
0.000 0.000 | 0.000 |
0.025 0.000 | 0.060 |
0.125 0.027 | 0.187 |
0.000 0.000 | 0.000 |
0.092 0.000 | 0.193 |
0.666 0.639 | 0.686 |
0.092 0.066 | 0.114 |
||
| Plot | Lyso | Other | |||||||||||
| Expt C |
6 peptides |
9 spectra |
|
0.000 0.000 | 0.000 |
1.000 1.000 | 1.000 |