 2
2peptides
spectra
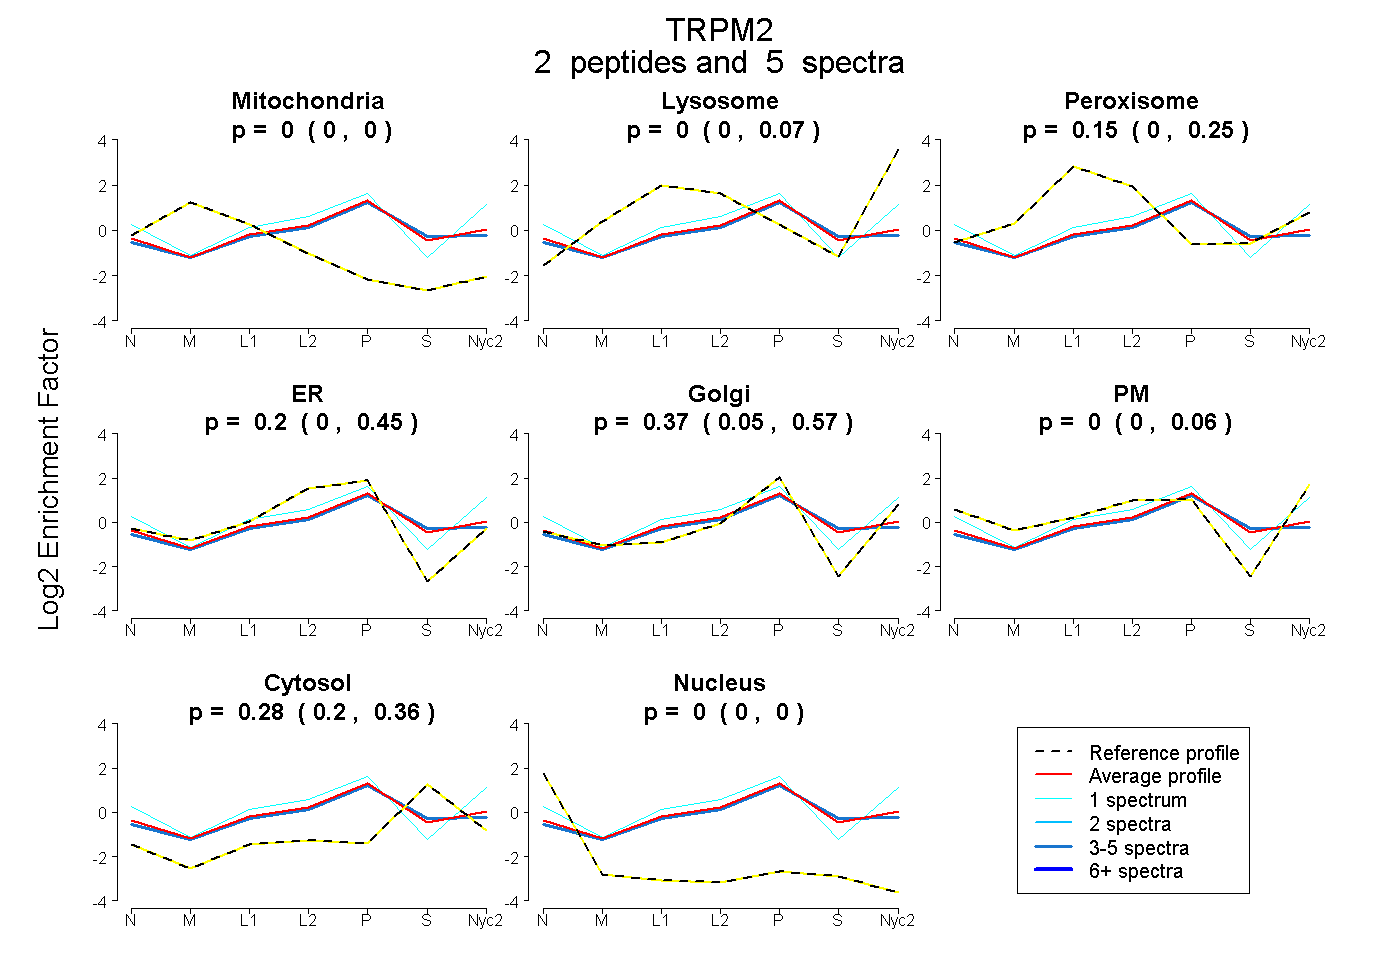
0.000 | 0.000
0.000 | 0.066
0.000 | 0.252
0.000 | 0.453
0.052 | 0.572
0.000 | 0.065
0.203 | 0.356
0.000 | 0.000
2peptides
spectra

0.000 | 0.021
0.976 | 1.000
| Plot | Mito | Lyso | Perox | ER | Golgi | PM | Cytosol | Nucleus | |||||
| Expt A |
2 peptides |
5 spectra |
|
0.000 0.000 | 0.000 |
0.000 0.000 | 0.066 |
0.147 0.000 | 0.252 |
0.199 0.000 | 0.453 |
0.370 0.052 | 0.572 |
0.000 0.000 | 0.065 |
0.284 0.203 | 0.356 |
0.000 0.000 | 0.000 |
||
| Plot | Lyso | Other | |||||||||||
| Expt C |
2 peptides |
9 spectra |
|
0.000 0.000 | 0.021 |
1.000 0.976 | 1.000 |