25
25peptides
spectra
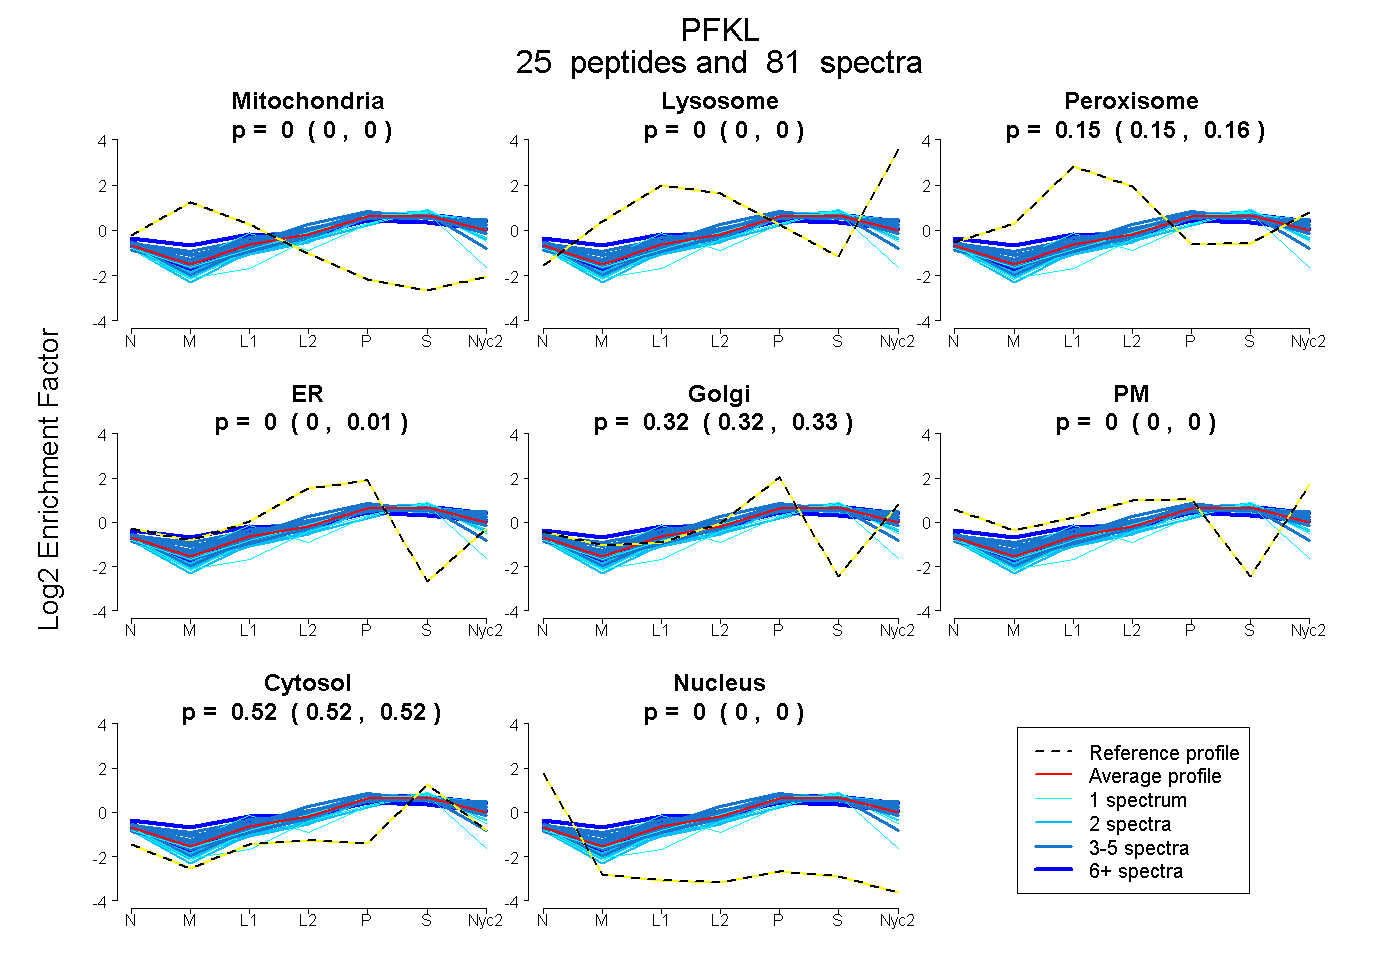
0.000 | 0.000
0.000 | 0.000
0.150 | 0.156
0.000 | 0.011
0.315 | 0.329
0.000 | 0.000
0.516 | 0.521
0.000 | 0.000
12peptides
spectra
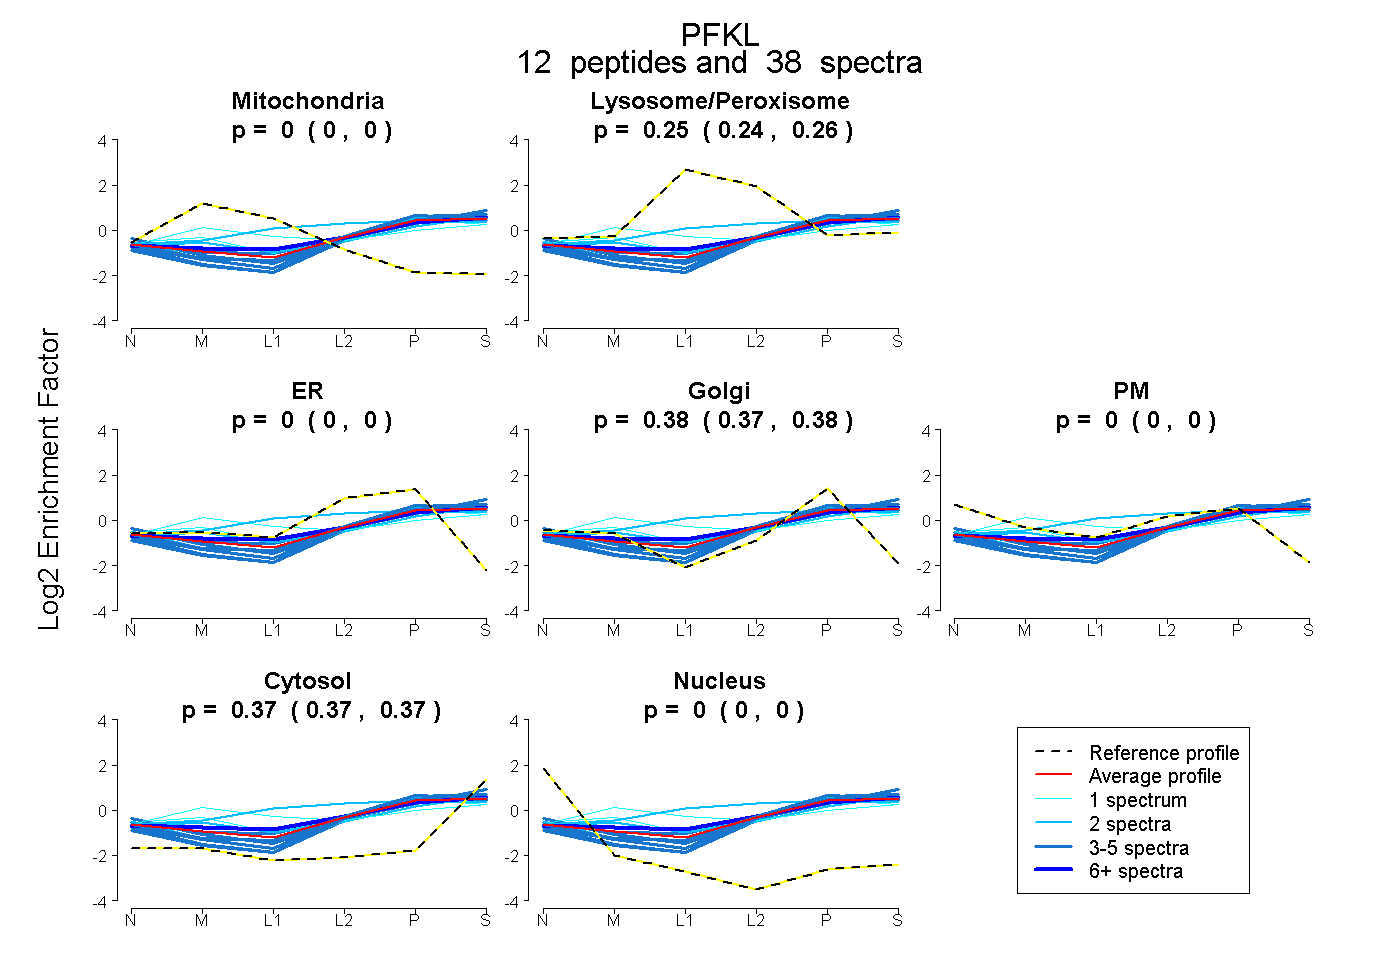
0.000 | 0.000
0.242 | 0.255
0.000 | 0.000
0.374 | 0.385
0.000 | 0.000
0.367 | 0.375
0.000 | 0.000