 3
3peptides
spectra
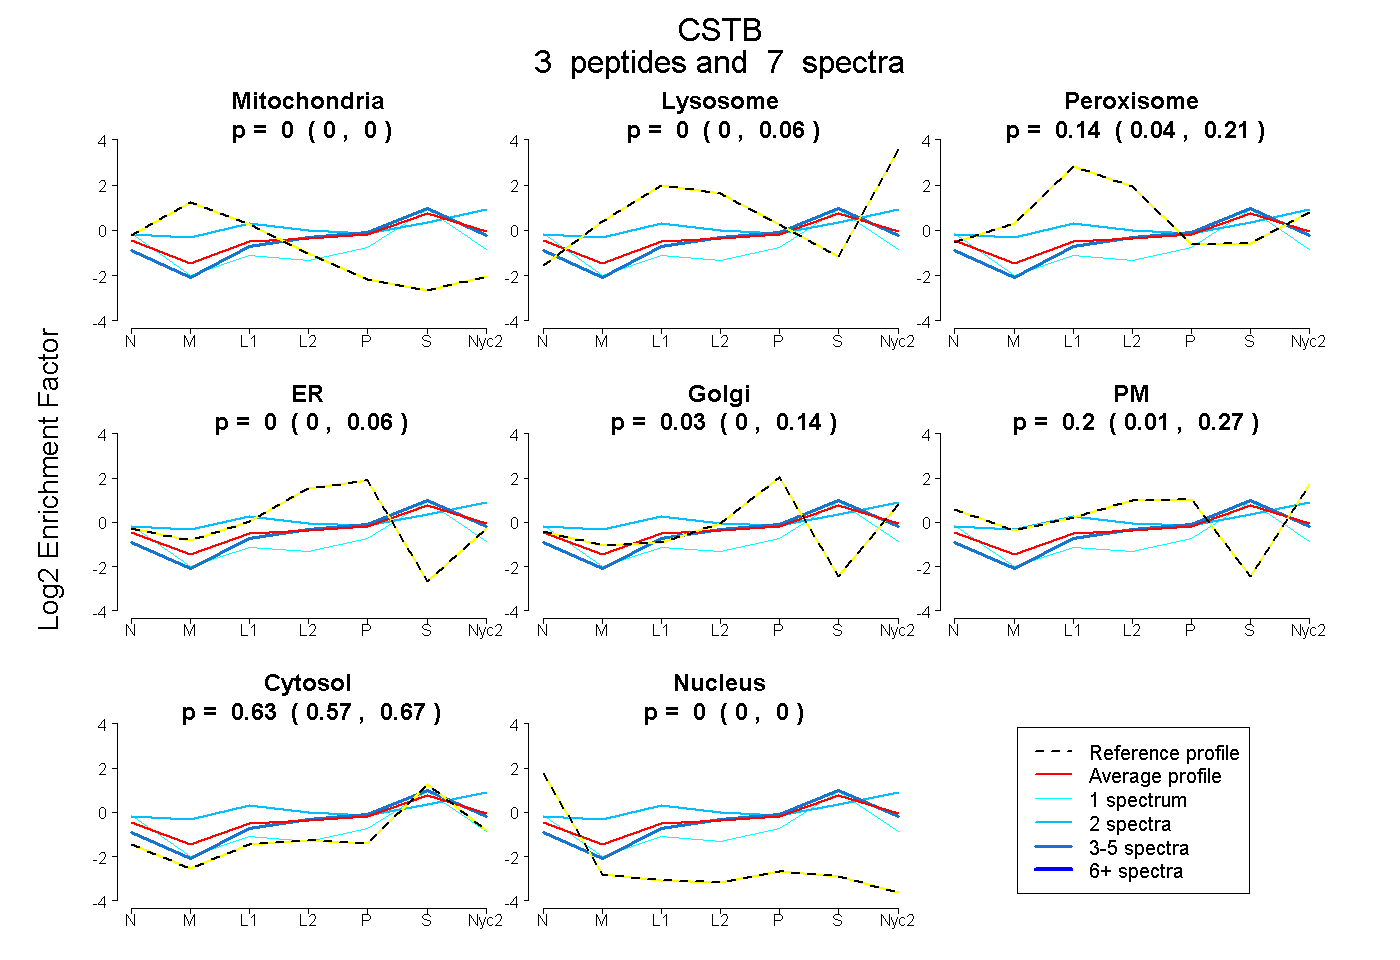
0.000 | 0.000
0.000 | 0.057
0.039 | 0.213
0.000 | 0.061
0.000 | 0.144
0.014 | 0.274
0.573 | 0.667
0.000 | 0.000
1peptide
spectrum
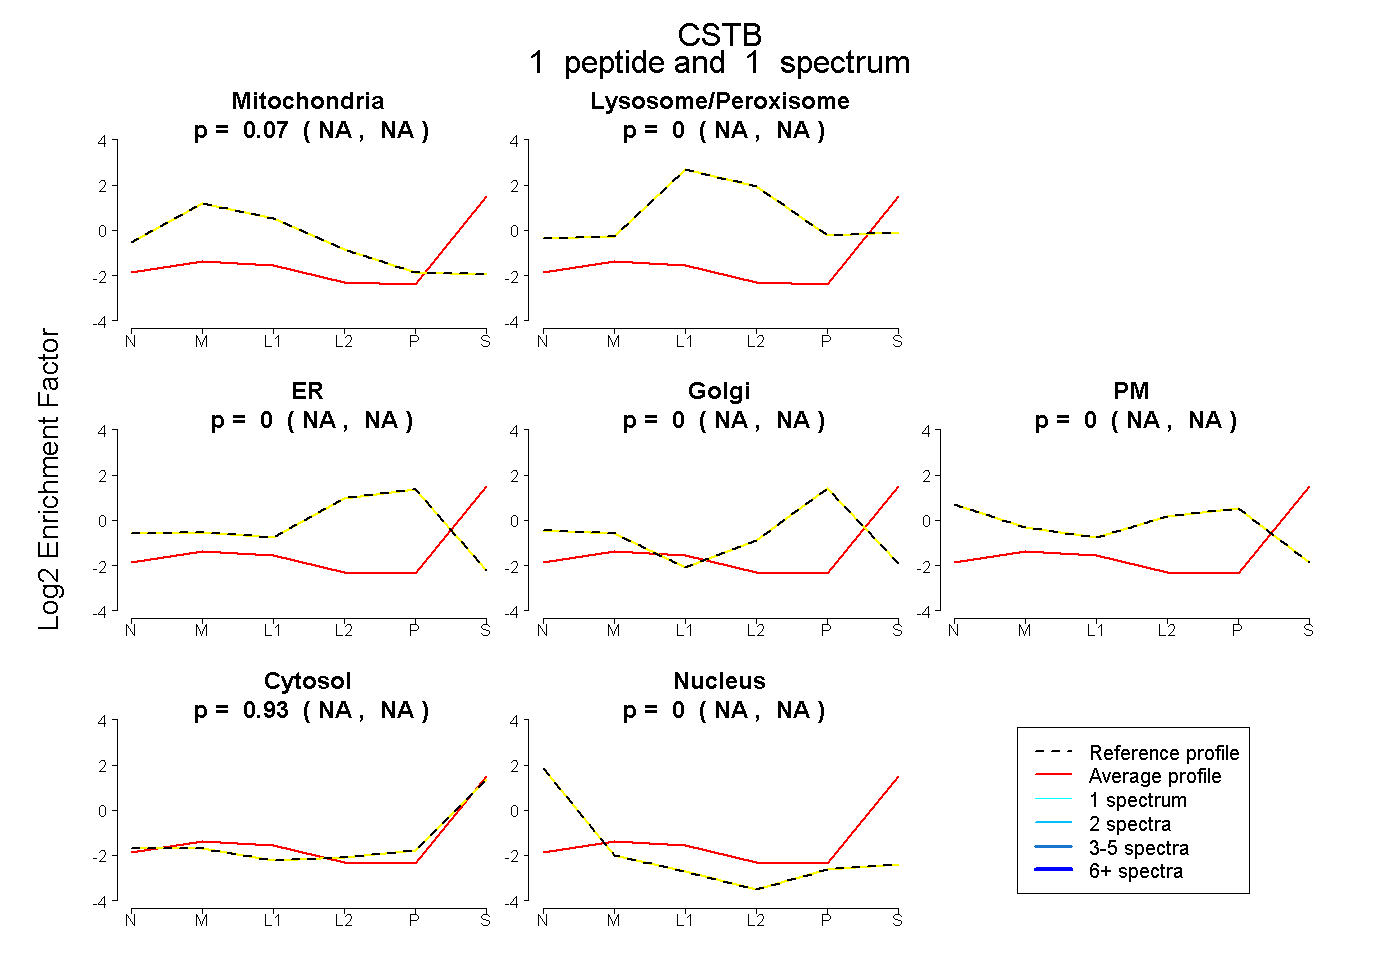
NA | NA
NA | NA
NA | NA
NA | NA
NA | NA
NA | NA
NA | NA
4peptides
spectra
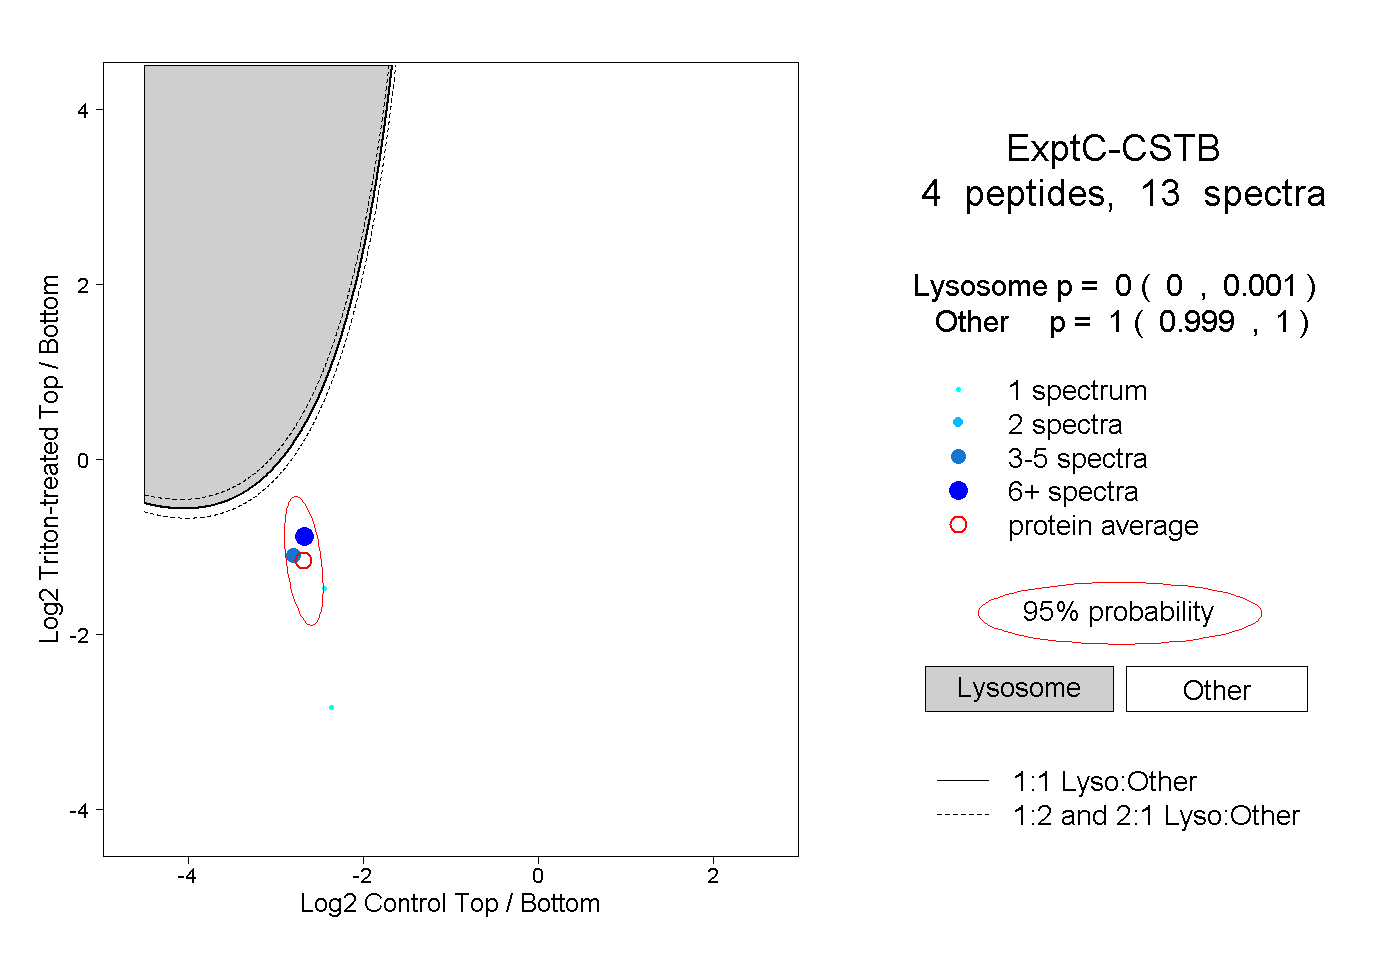
0.000 | 0.001
0.999 | 1.000
1peptide
spectra
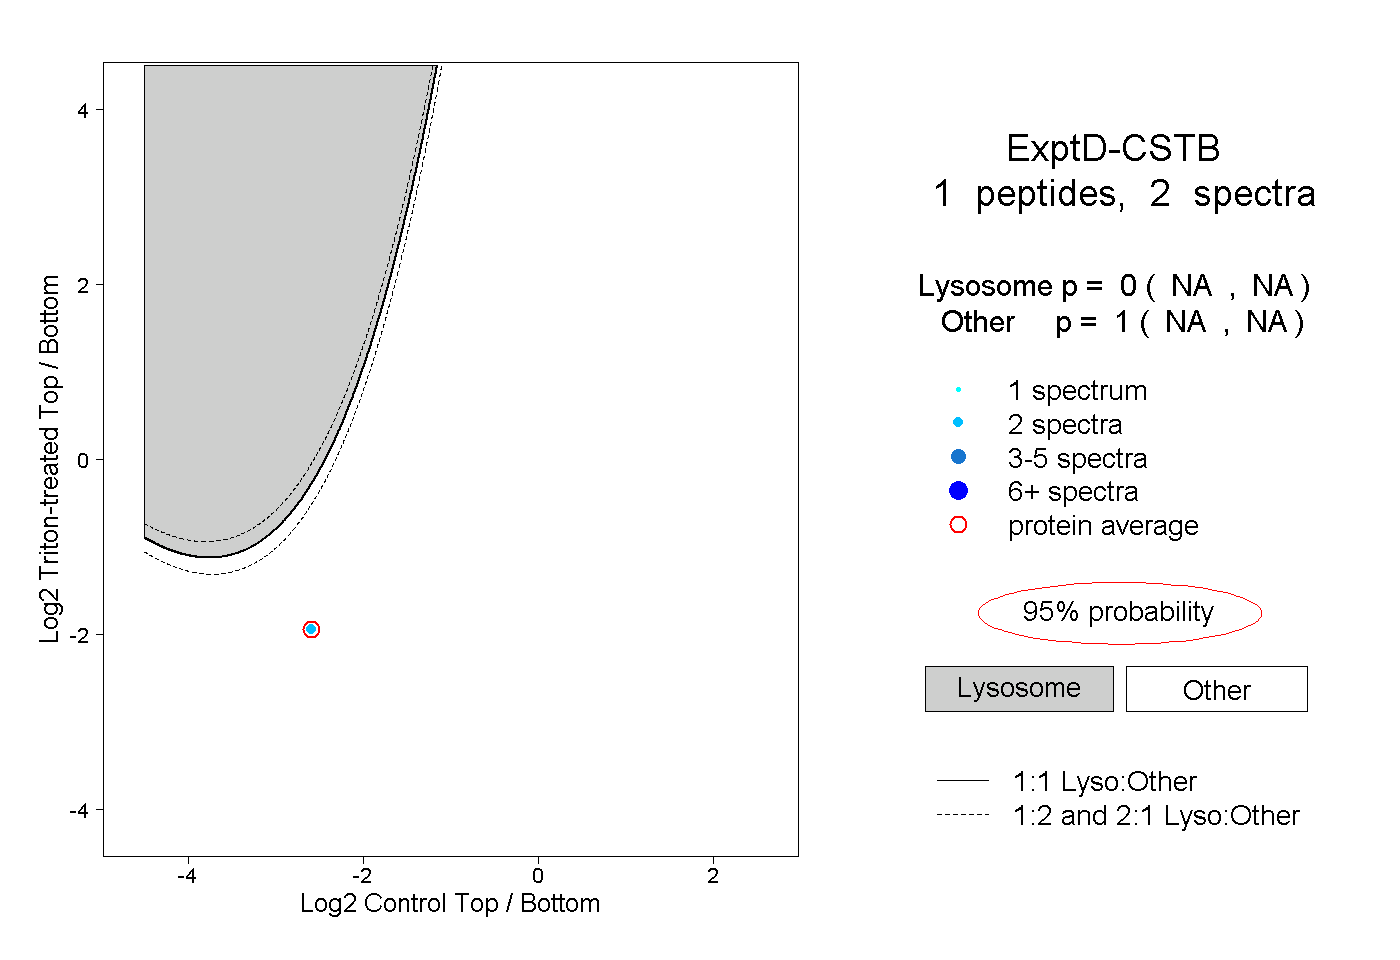
NA | NA
NA | NA