GCN1L1
[ENSRNOP00000001517]
Main page
| | | Plot |
Mito |
Lyso |
|
Perox |
ER |
Golgi |
PM |
Cytosol |
Nucleus |
|
| Expt A |
 94
94
peptides |
216
spectra |
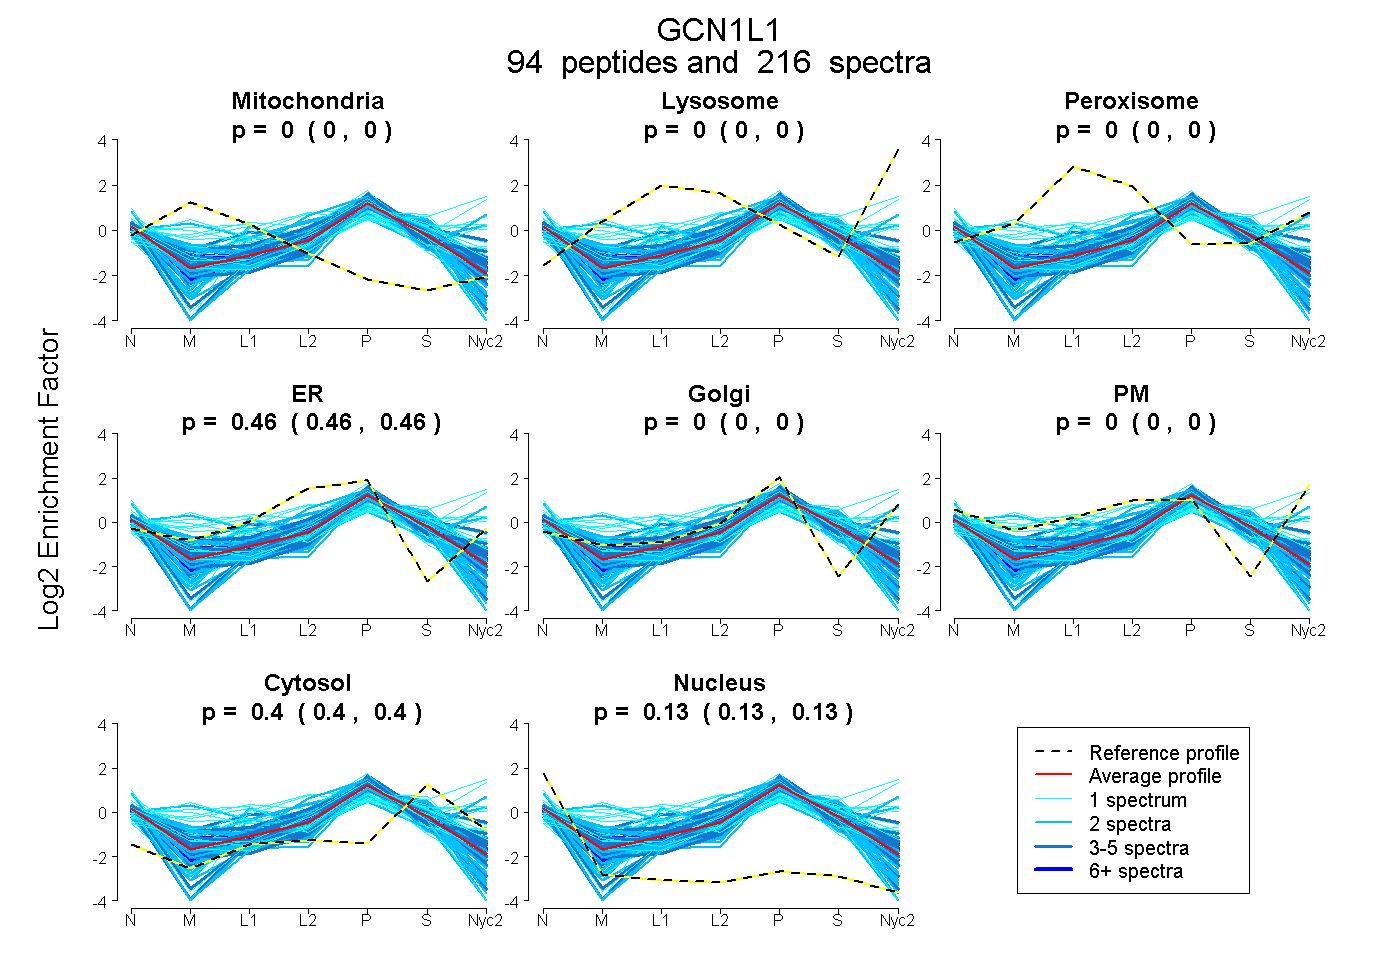 |
0.000
0.000 | 0.000 |
0.000
0.000 | 0.000 |
|
0.000
0.000 | 0.000 |
0.464
0.463 | 0.465 |
0.000
0.000 | 0.000 |
0.000
0.000 | 0.000 |
0.402
0.401 | 0.403 |
0.134
0.132 | 0.135 |
|
| | | Plot |
Mito |
|
Lyso or Perox |
|
ER |
Golgi |
PM |
Cytosol |
Nucleus |
|
| Expt B |
45
peptides |
85
spectra |
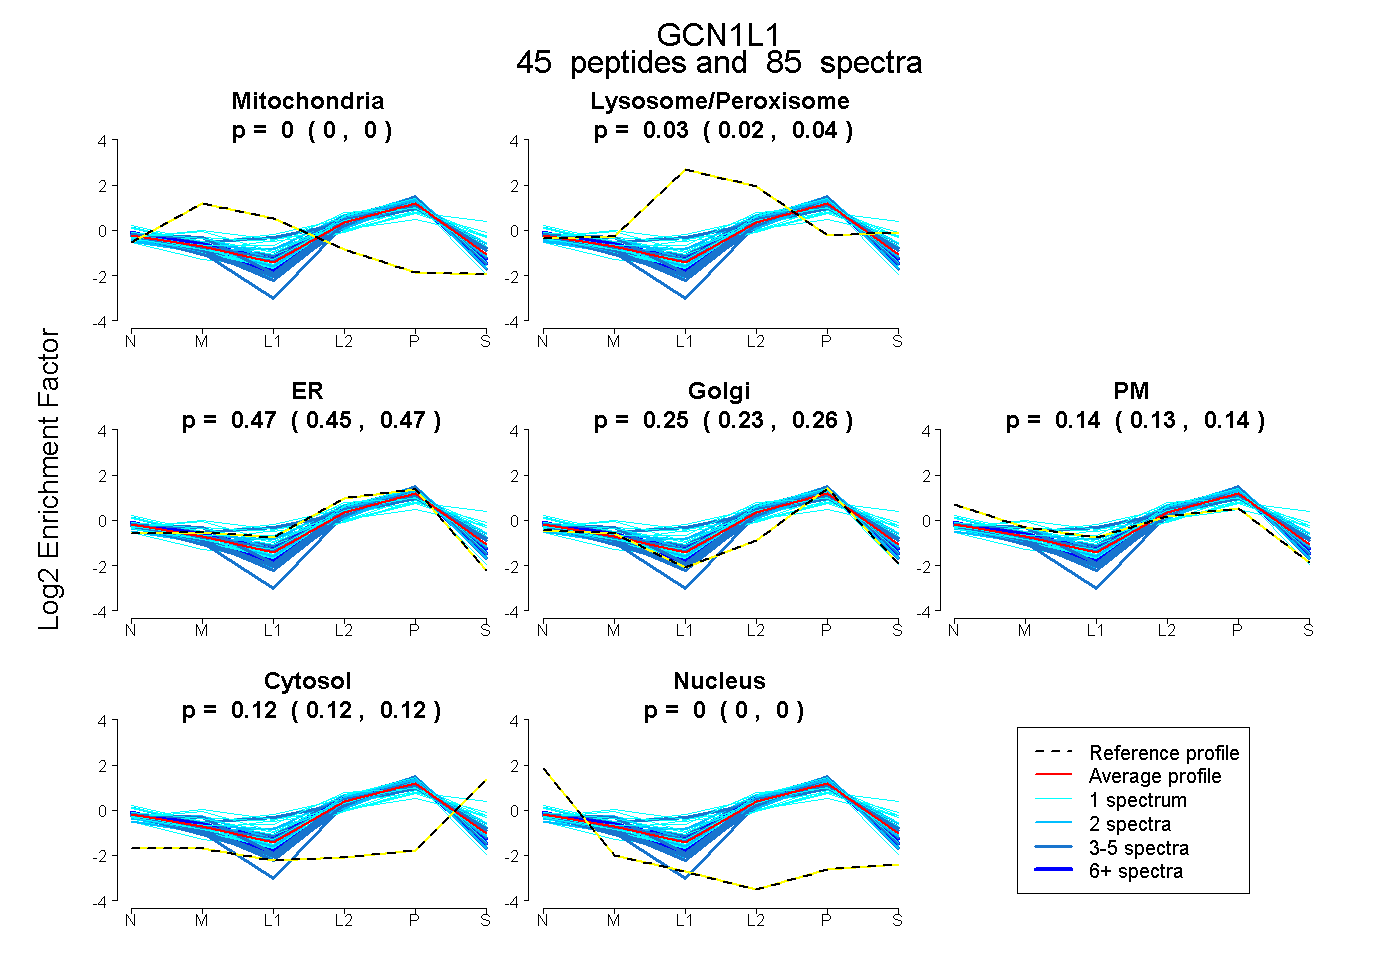 |
0.000
0.000 | 0.000 |
|
0.031
0.023 | 0.038 |
|
0.465
0.454 | 0.475 |
0.246
0.234 | 0.256 |
0.136
0.130 | 0.142 |
0.121
0.118 | 0.124 |
0.000
0.000 | 0.000 |
|
| | | Plot |
|
Lyso |
|
|
|
|
|
|
|
Other |
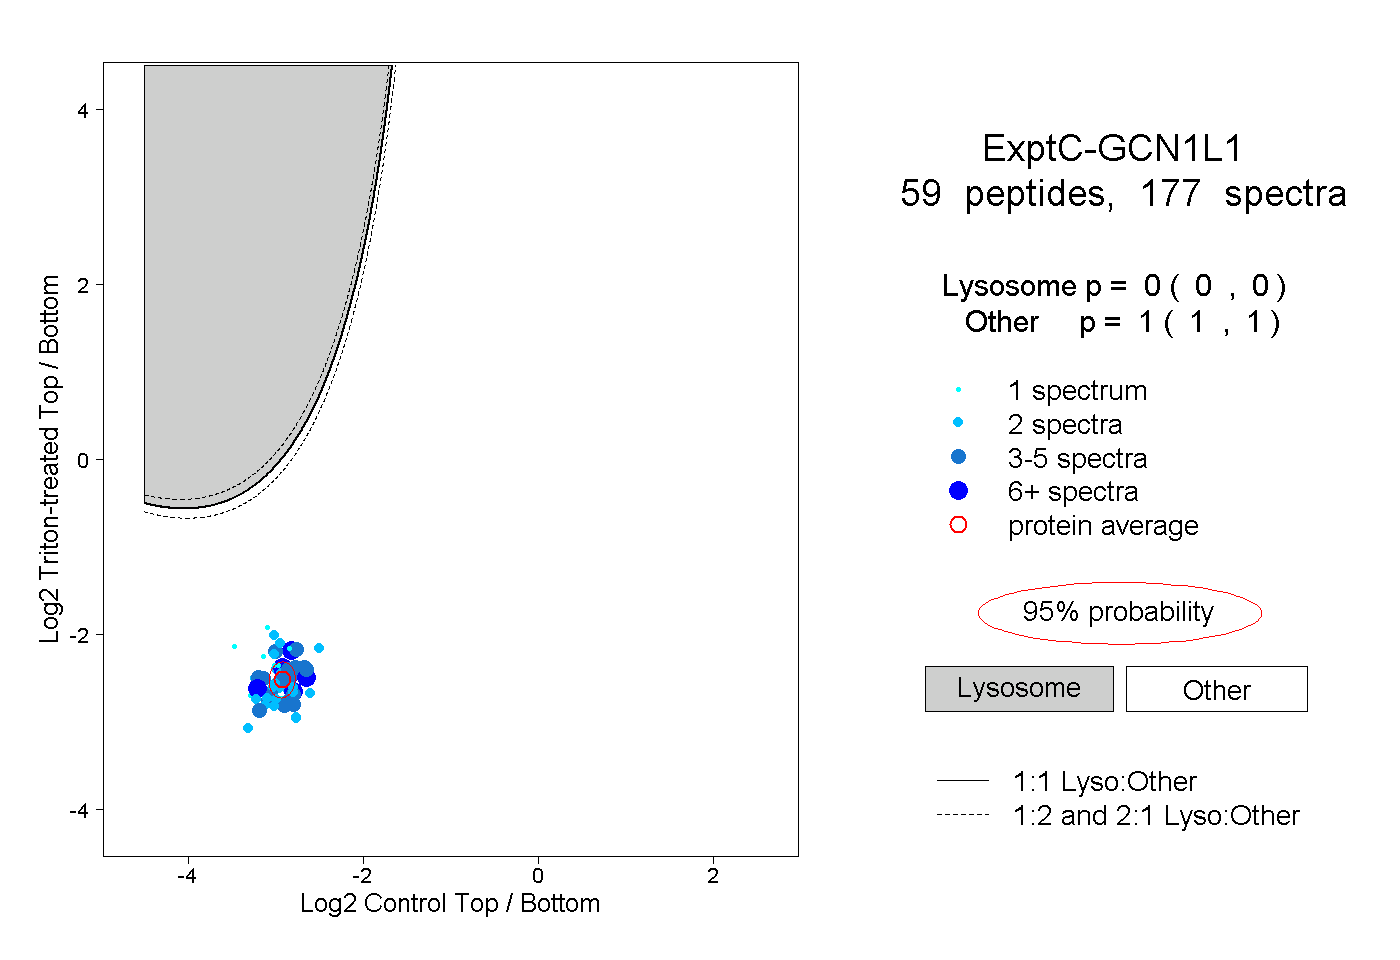
| Expt C |
59
peptides |
177
spectra |
 |
|
0.000
0.000 | 0.000 |
|
|
|
|
|
|
|
1.000
1.000 | 1.000 |
| | | Plot |
|
Lyso |
|
|
|
|
|
|
|
Other |
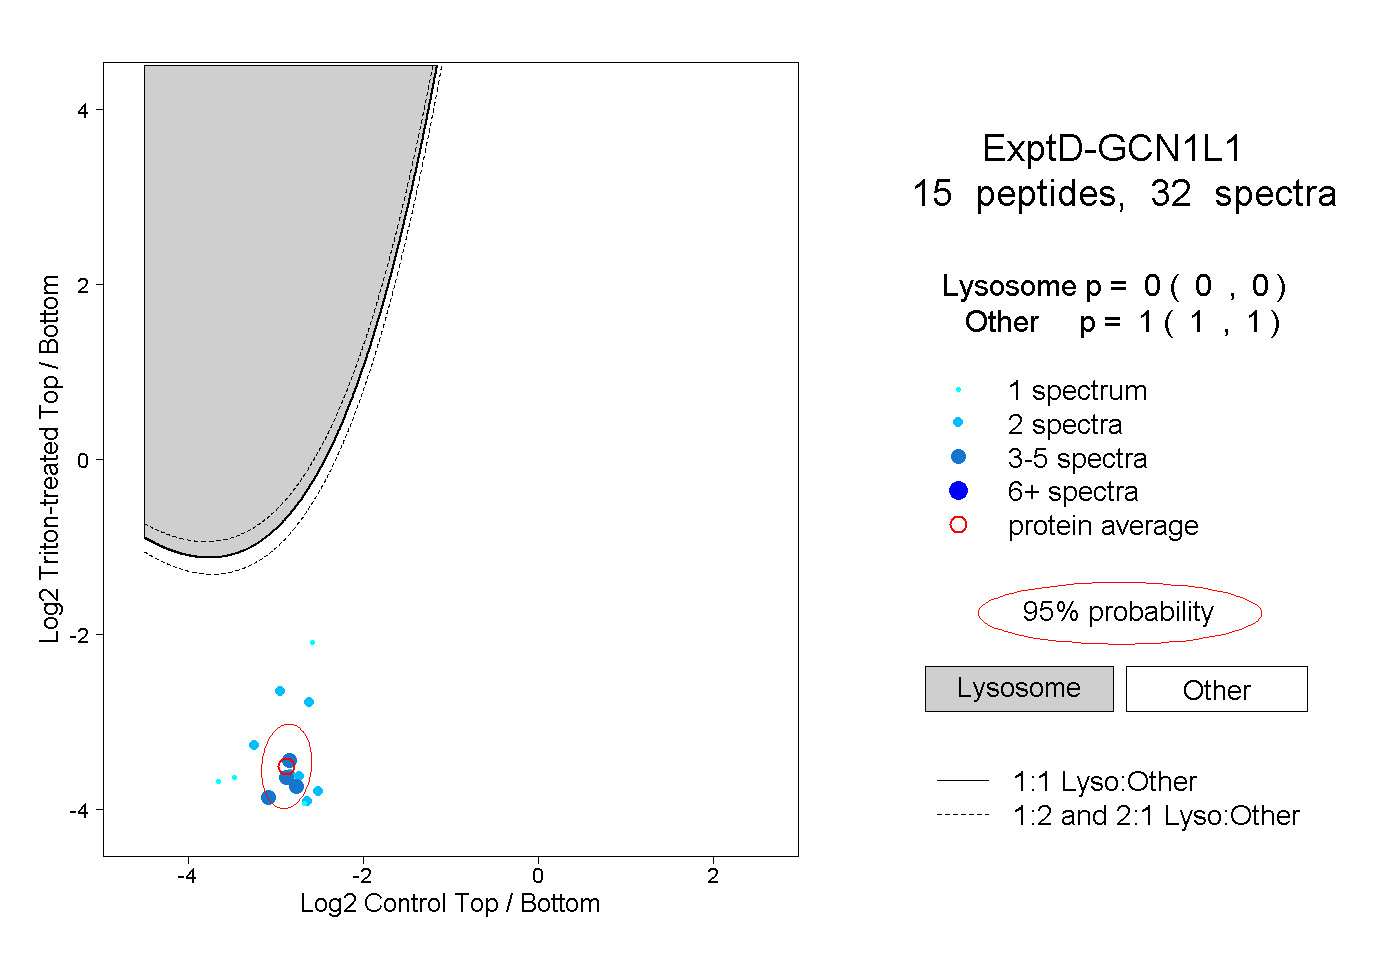
| Expt D |
15
peptides |
32
spectra |
 |
|
0.000
0.000 | 0.000 |
|
|
|
|
|
|
|
1.000
1.000 | 1.000 |
| 1 spectrum, VKPIVAK |
|
0.000 |
|
|
|
|
|
|
|
1.000 |
| 3 spectra, LTTPPVNTR |
|
0.000 |
|
|
|
|
|
|
|
1.000 |
| 2 spectra, GLANQLK |
|
0.000 |
|
|
|
|
|
|
|
1.000 |
| 2 spectra, VDIAPHVR |
|
0.000 |
|
|
|
|
|
|
|
1.000 |
| 2 spectra, VISESPPDQWEAR |
|
0.000 |
|
|
|
|
|
|
|
1.000 |
| 2 spectra, TLGDLVR |
|
0.000 |
|
|
|
|
|
|
|
1.000 |
| 3 spectra, QIGSVIR |
|
0.000 |
|
|
|
|
|
|
|
1.000 |
| 4 spectra, IVVSNTPR |
|
0.000 |
|
|
|
|
|
|
|
1.000 |
| 2 spectra, ALADENEFVR |
|
0.000 |
|
|
|
|
|
|
|
1.000 |
| 2 spectra, DLPEGAVK |
|
0.000 |
|
|
|
|
|
|
|
1.000 |
| 4 spectra, LANGLLEELK |
|
0.000 |
|
|
|
|
|
|
|
1.000 |
| 1 spectrum, VTTASVK |
|
0.000 |
|
|
|
|
|
|
|
1.000 |
| 1 spectrum, STLLEFYVK |
|
0.000 |
|
|
|
|
|
|
|
1.000 |
| 2 spectra, AADALGK |
|
0.000 |
|
|
|
|
|
|
|
1.000 |
| 1 spectrum, ALCDPLEEVR |
|
0.000 |
|
|
|
|
|
|
|
1.000 |