 19
19peptides
spectra
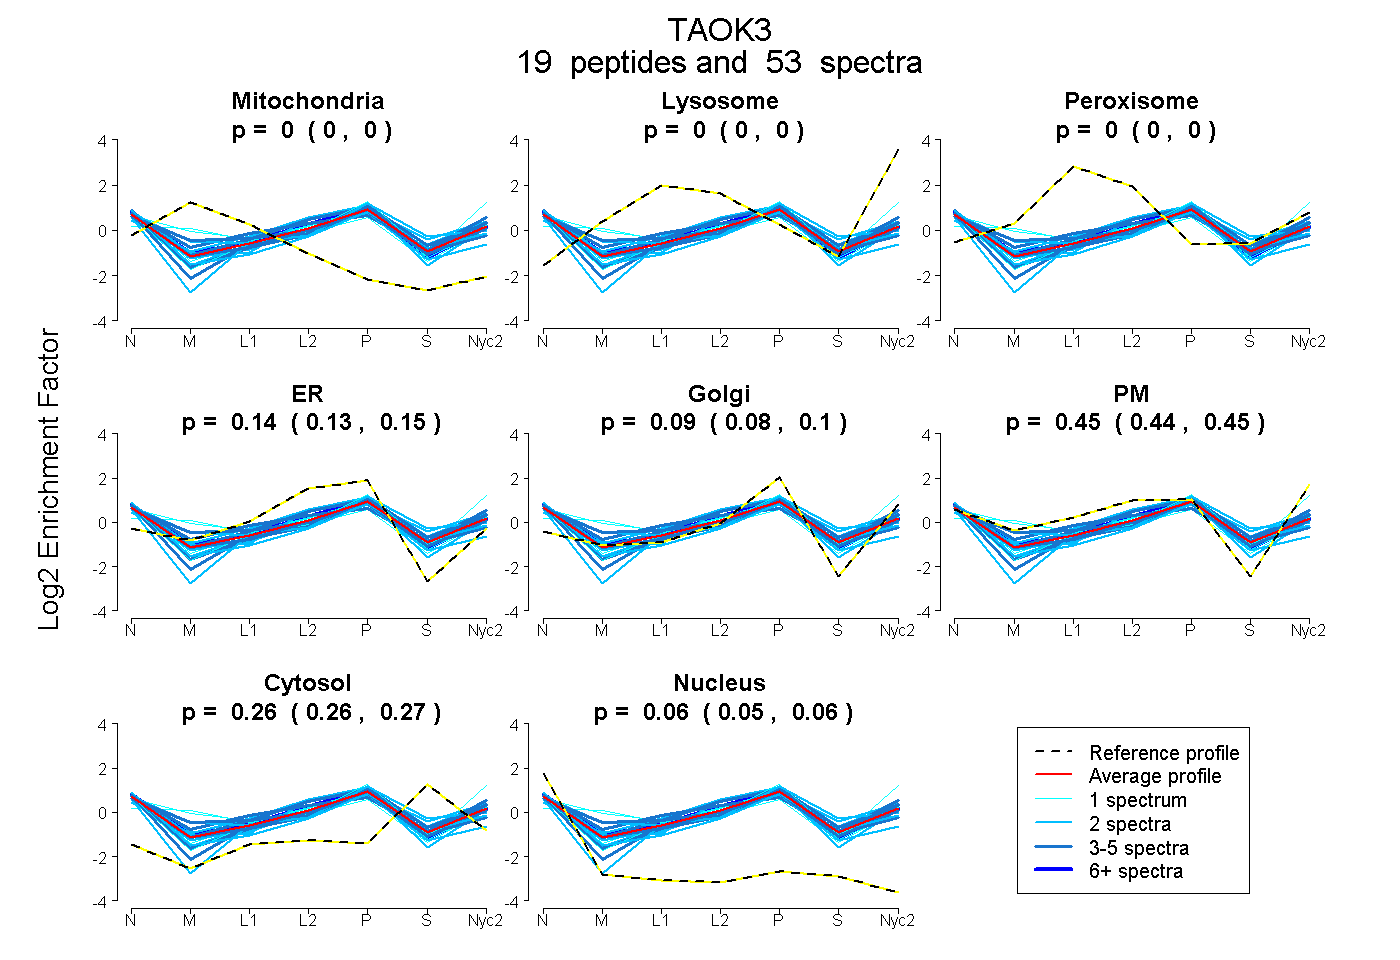
0.000 | 0.000
0.000 | 0.000
0.000 | 0.000
0.132 | 0.149
0.084 | 0.100
0.438 | 0.453
0.258 | 0.265
0.055 | 0.059
5peptides
spectra

0.000 | 0.000
0.000 | 0.037
0.000 | 0.015
0.130 | 0.199
0.683 | 0.769
0.067 | 0.107
0.000 | 0.000
21peptides
spectra

0.000 | 0.000
1.000 | 1.000
7peptides
spectra
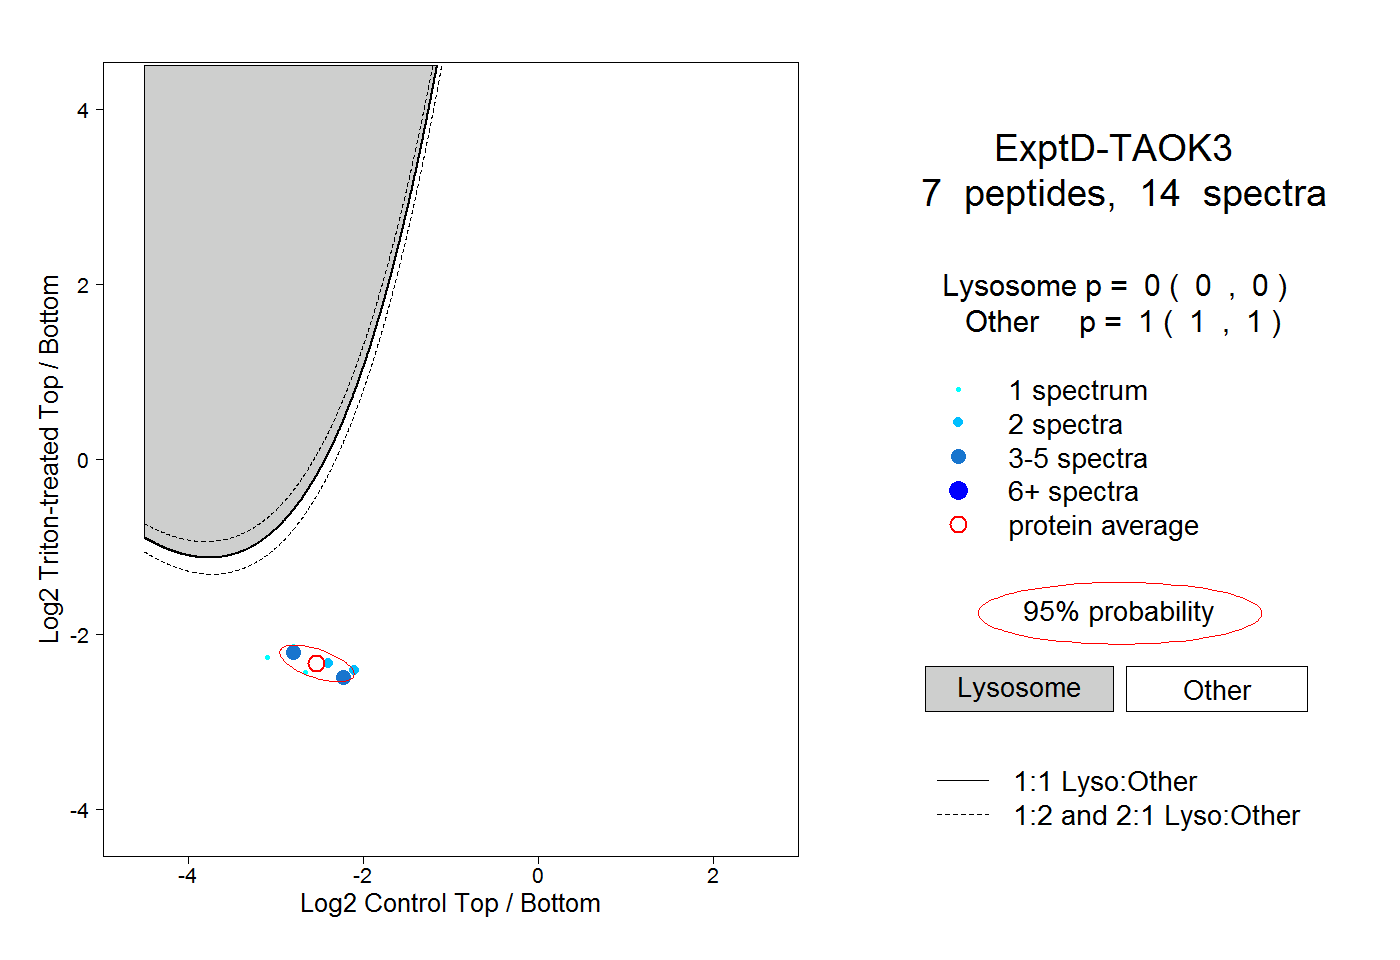
0.000 | 0.000
1.000 | 1.000