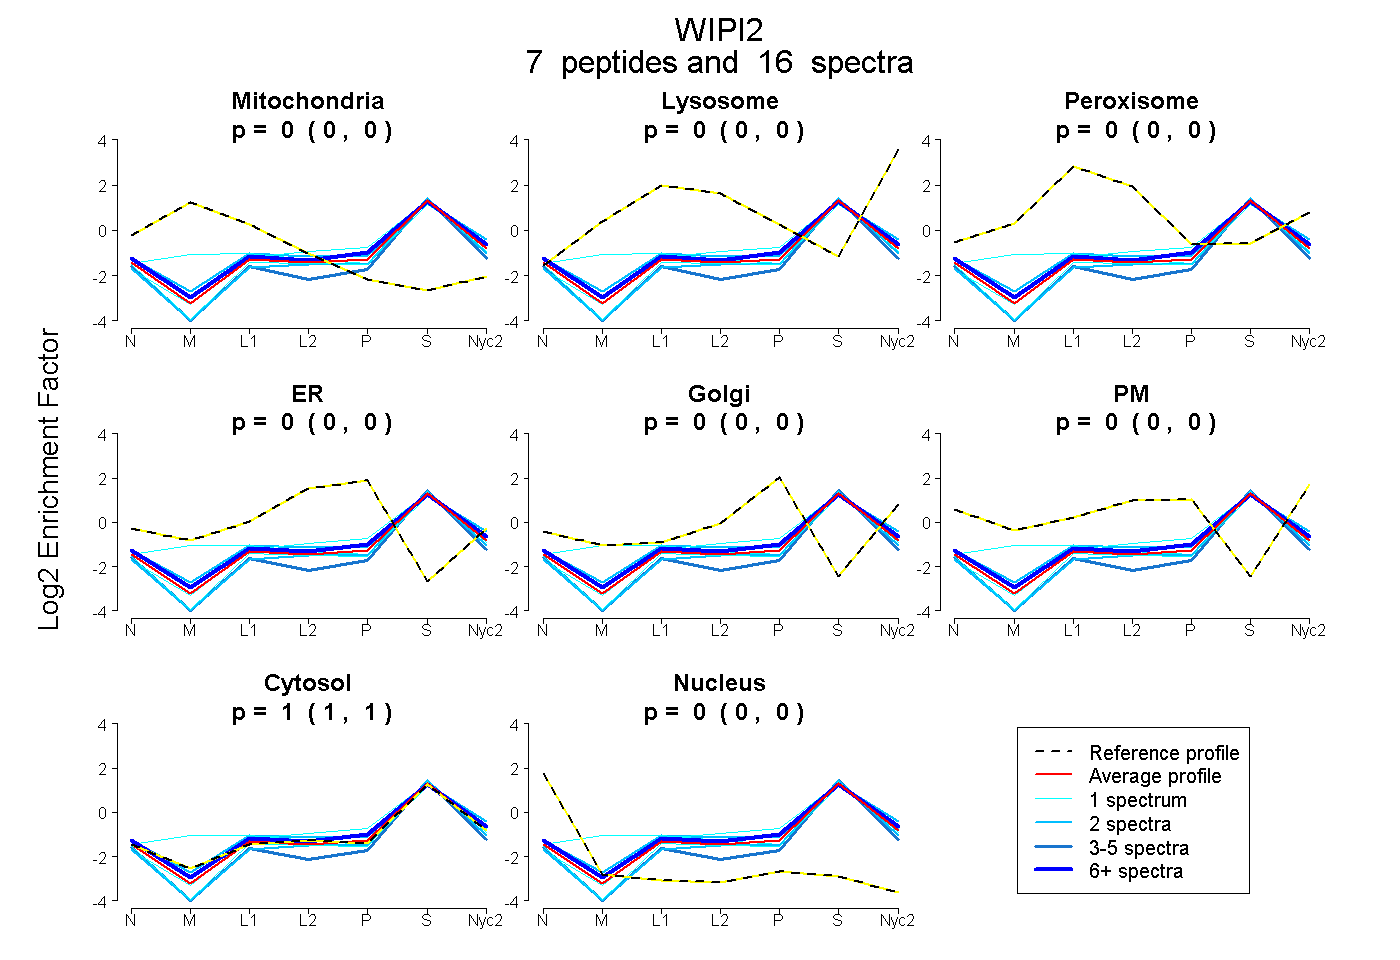
 7
7peptides
spectra
0.000 | 0.000
0.000 | 0.000
0.000 | 0.000
0.000 | 0.000
0.000 | 0.000
0.000 | 0.000
0.998 | 1.000
0.000 | 0.001
| Plot | Mito | Lyso | Perox | ER | Golgi | PM | Cytosol | Nucleus | |||||
| Expt A |
7 peptides |
16 spectra |
|
0.000 0.000 | 0.000 |
0.000 0.000 | 0.000 |
0.000 0.000 | 0.000 |
0.000 0.000 | 0.000 |
0.000 0.000 | 0.000 |
0.000 0.000 | 0.000 |
1.000 0.998 | 1.000 |
0.000 0.000 | 0.001 |
| 1 spectrum, LDEDSEHPPMILR | 0.000 | 0.000 | 0.000 | 0.038 | 0.000 | 0.000 | 0.962 | 0.000 | ||
| 2 spectra, LPFCGHK | 0.000 | 0.000 | 0.000 | 0.000 | 0.000 | 0.000 | 0.991 | 0.009 | ||
| 6 spectra, VLHTIR | 0.000 | 0.000 | 0.000 | 0.000 | 0.040 | 0.000 | 0.960 | 0.000 | ||
| 2 spectra, AFATVR | 0.000 | 0.056 | 0.000 | 0.000 | 0.000 | 0.008 | 0.936 | 0.000 | ||
| 1 spectrum, NICSLTTIQK | 0.000 | 0.000 | 0.000 | 0.000 | 0.000 | 0.000 | 0.994 | 0.006 | ||
| 1 spectrum, LFEFR | 0.143 | 0.065 | 0.000 | 0.000 | 0.000 | 0.000 | 0.792 | 0.000 | ||
| 3 spectra, GAYVPSSPTR | 0.000 | 0.000 | 0.000 | 0.000 | 0.000 | 0.000 | 0.939 | 0.061 |
| Plot | Mito | Lyso or Perox | ER | Golgi | PM | Cytosol | Nucleus | ||||||
| Expt B |
1 peptide |
2 spectra |
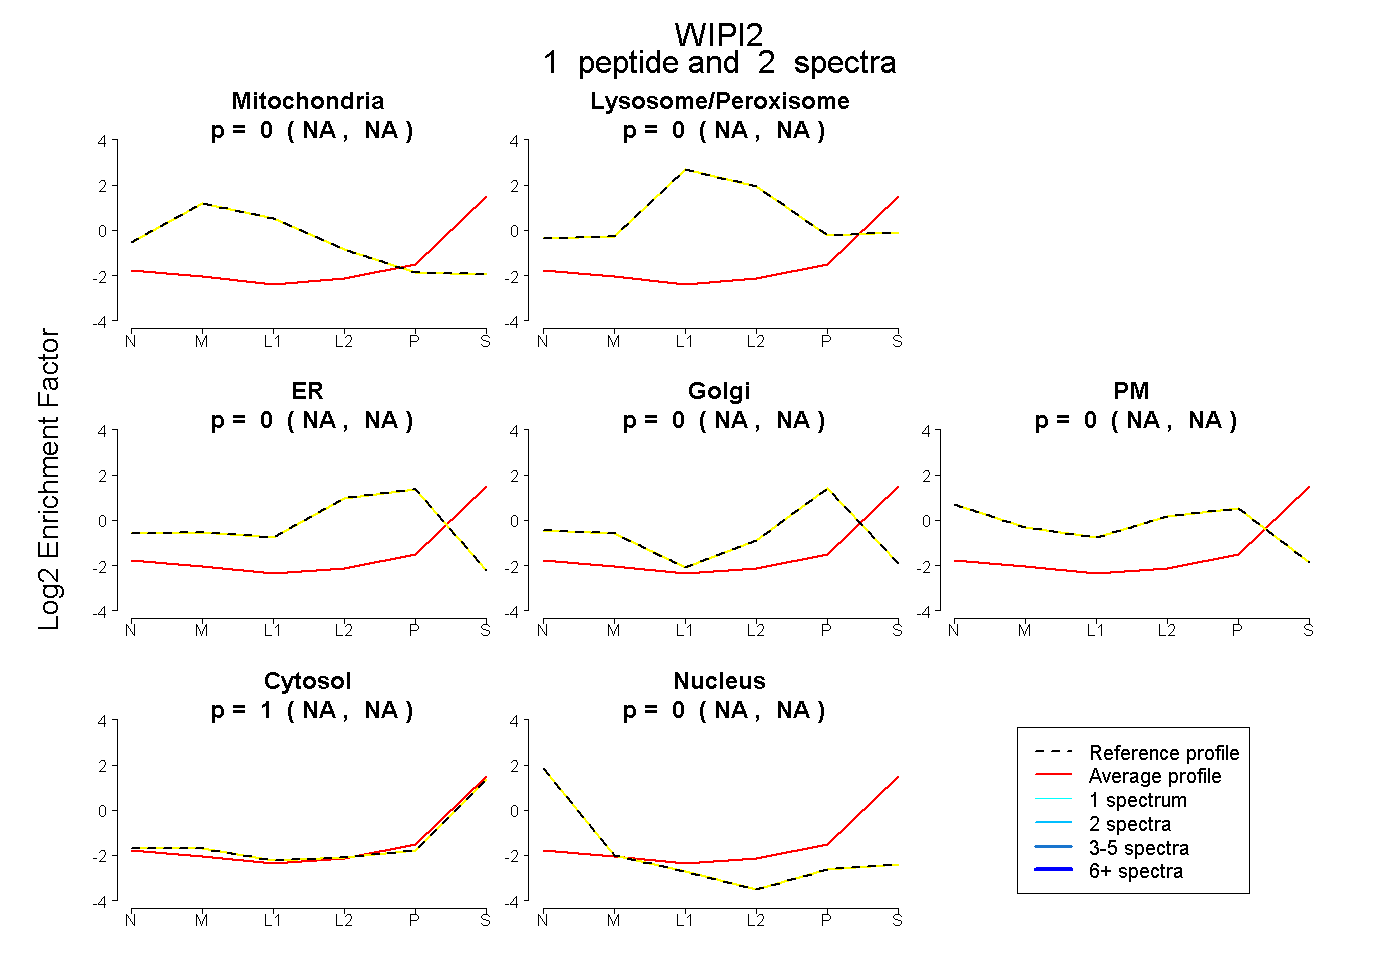 |
0.000 NA | NA |
0.000 NA | NA |
0.000 NA | NA |
0.000 NA | NA |
0.000 NA | NA |
1.000 NA | NA |
0.000 NA | NA |
|||
| Plot | Lyso | Other | |||||||||||
| Expt C |
7 peptides |
25 spectra |
 |
0.000 0.000 | 0.000 |
1.000 1.000 | 1.000 |