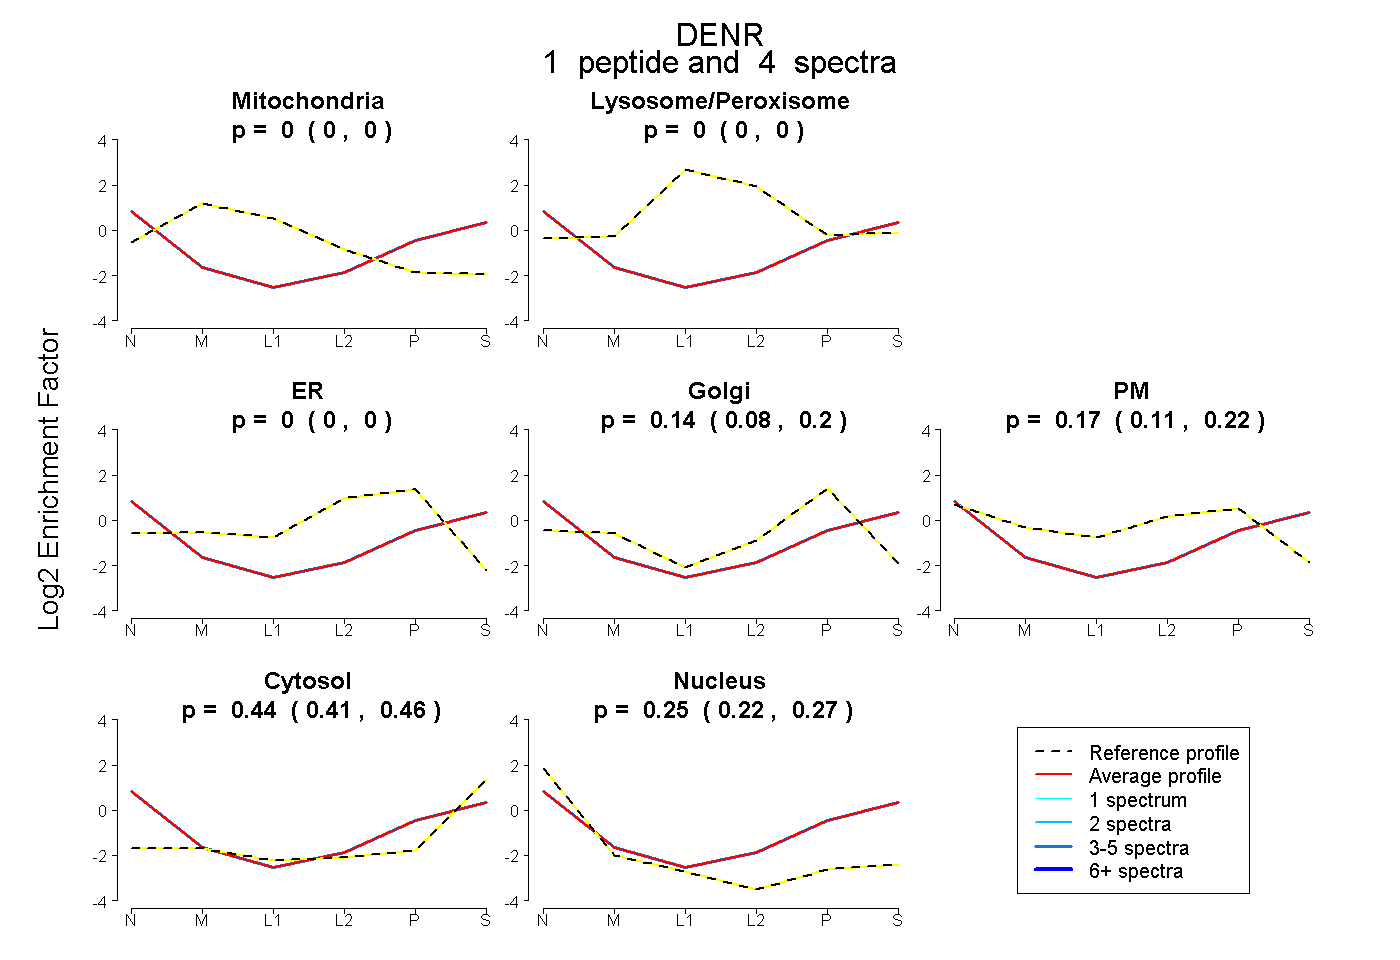
 3
3peptides
spectra

0.000 | 0.000
0.000 | 0.000
0.000 | 0.000
0.000 | 0.155
0.000 | 0.205
0.000 | 0.089
0.504 | 0.529
0.230 | 0.314
1peptide
spectra
0.000 | 0.000
0.000 | 0.000
0.000 | 0.000
0.080 | 0.196
0.113 | 0.223
0.408 | 0.462
0.221 | 0.268
1peptide
spectrum
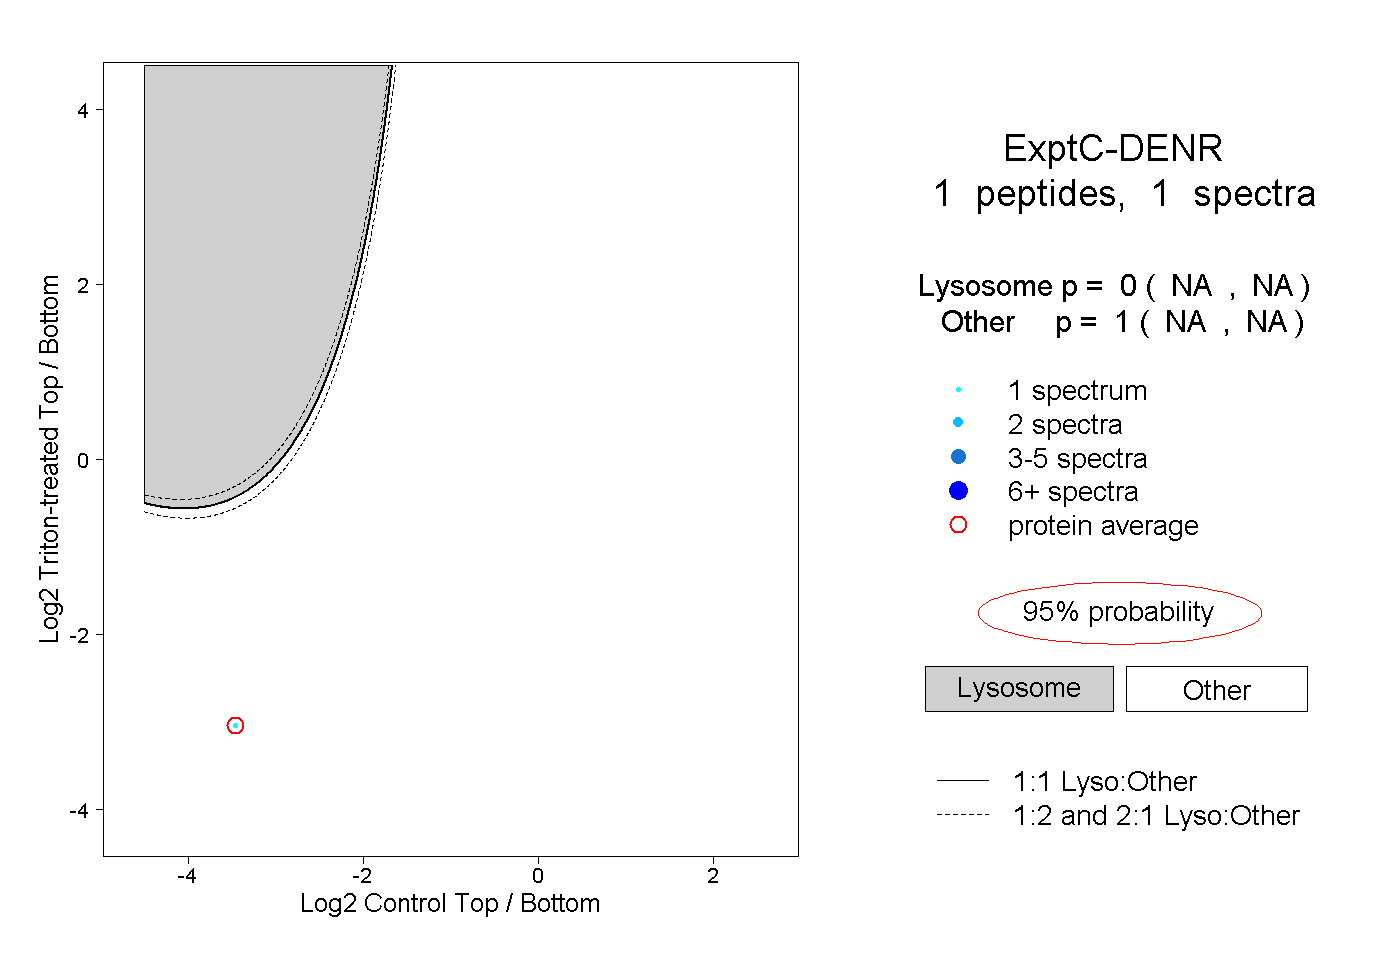
NA | NA
NA | NA
1peptide
spectra
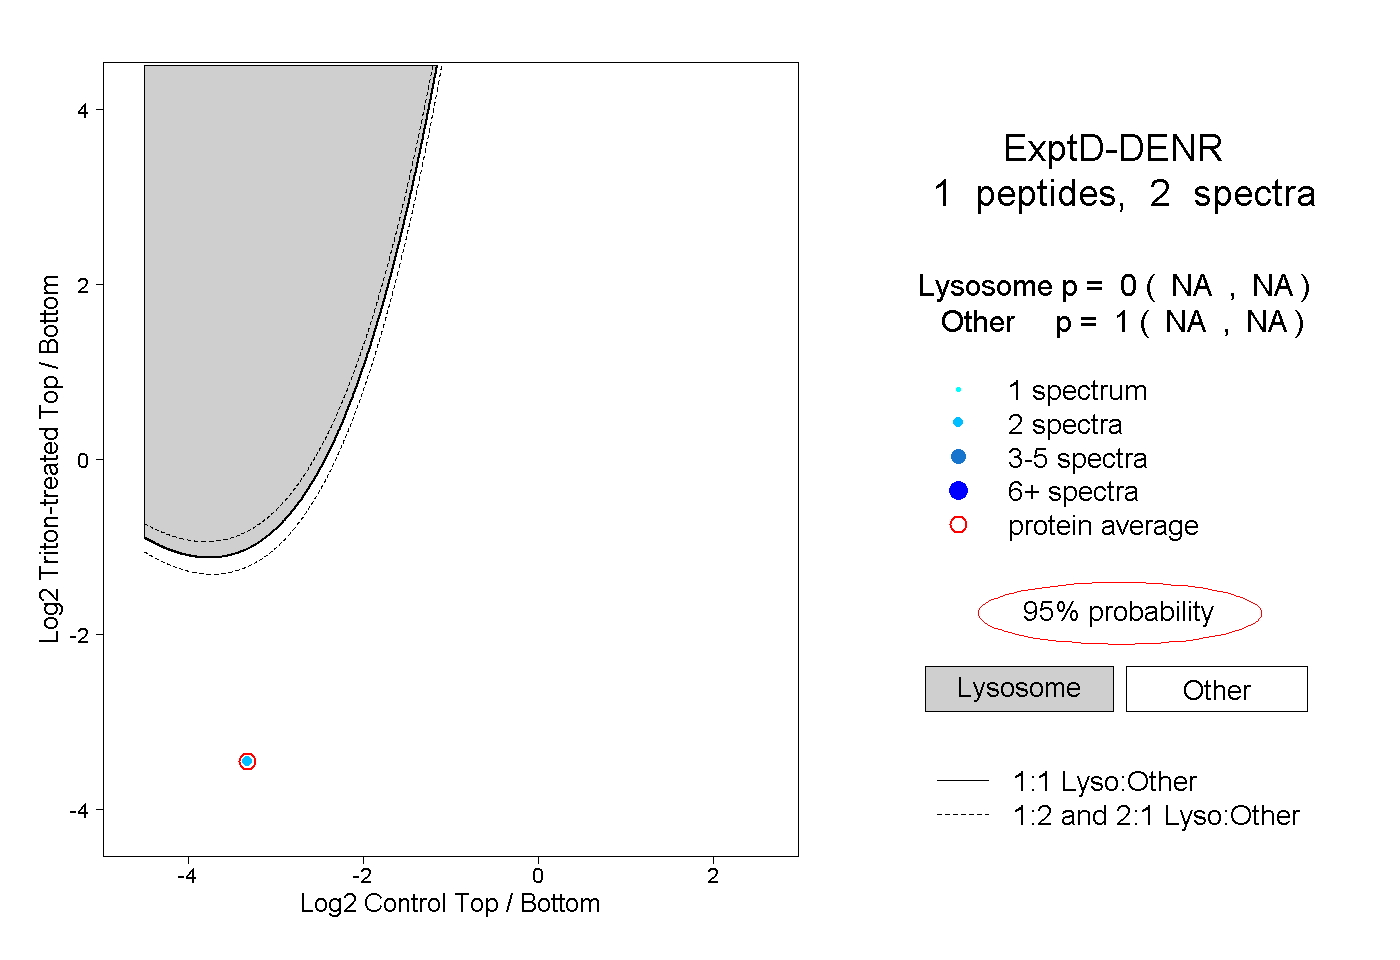
NA | NA
NA | NA