 3
3peptides
spectra
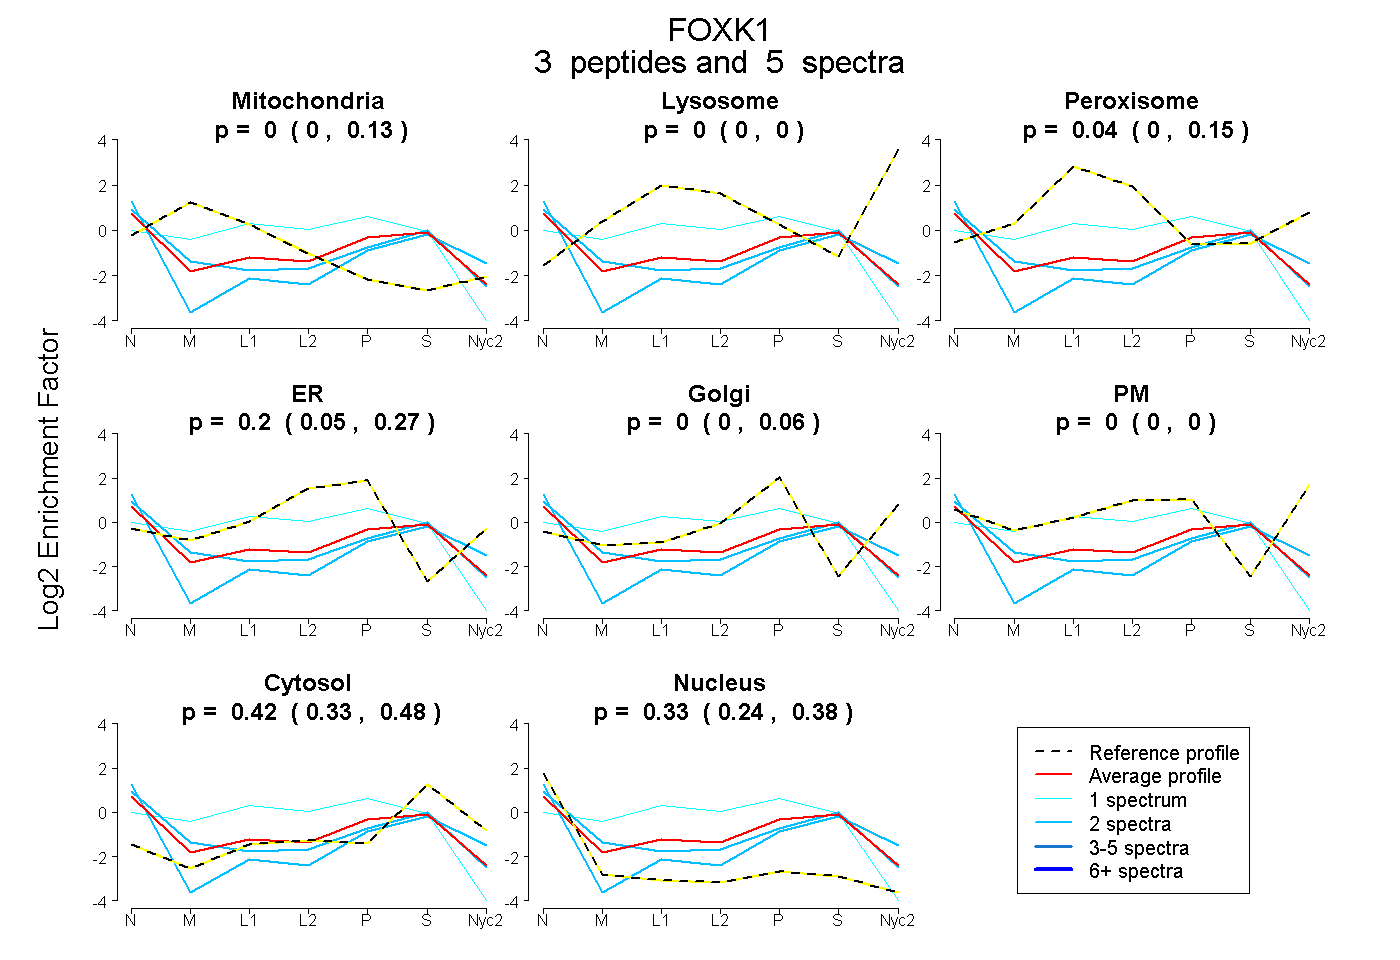
0.000 | 0.129
0.000 | 0.000
0.000 | 0.146
0.053 | 0.270
0.000 | 0.064
0.000 | 0.000
0.334 | 0.478
0.240 | 0.384
| Plot | Mito | Lyso | Perox | ER | Golgi | PM | Cytosol | Nucleus | |||||
| Expt A |
3 peptides |
5 spectra |
|
0.000 0.000 | 0.129 |
0.000 0.000 | 0.000 |
0.041 0.000 | 0.146 |
0.205 0.053 | 0.270 |
0.000 0.000 | 0.064 |
0.000 0.000 | 0.000 |
0.424 0.334 | 0.478 |
0.330 0.240 | 0.384 |
| 2 spectra, IHIPEPDLR | 0.081 | 0.000 | 0.000 | 0.128 | 0.000 | 0.000 | 0.438 | 0.353 | ||
| 1 spectrum, GAPALQLPQQCTFR | 0.324 | 0.000 | 0.000 | 0.336 | 0.000 | 0.000 | 0.298 | 0.041 | ||
| 2 spectra, QSPGPALAR | 0.000 | 0.000 | 0.000 | 0.000 | 0.082 | 0.000 | 0.482 | 0.436 |