TMED2
[ENSRNOP00000001397]
Main page
| | | Plot |
Mito |
Lyso |
|
Perox |
ER |
Golgi |
PM |
Cytosol |
Nucleus |
|
| Expt A |
 10
10
peptides |
103
spectra |
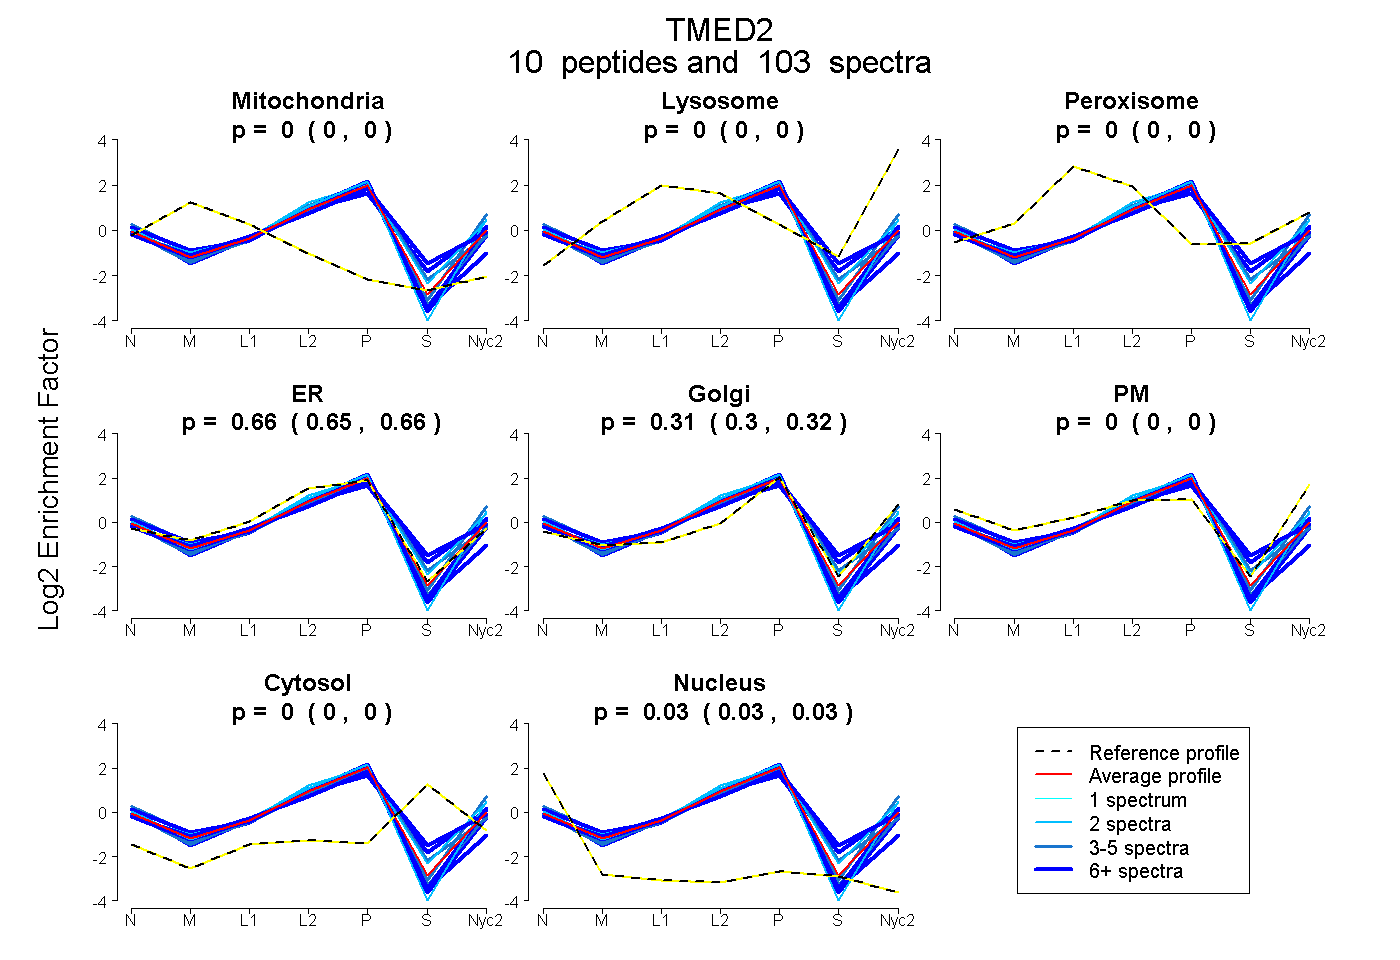 |
0.000
0.000 | 0.000 |
0.000
0.000 | 0.000 |
|
0.000
0.000 | 0.000 |
0.657
0.648 | 0.664 |
0.311
0.301 | 0.321 |
0.000
0.000 | 0.000 |
0.000
0.000 | 0.000 |
0.032
0.029 | 0.034 |
|
| | | Plot |
Mito |
|
Lyso or Perox |
|
ER |
Golgi |
PM |
Cytosol |
Nucleus |
|
| Expt B |
7
peptides |
20
spectra |
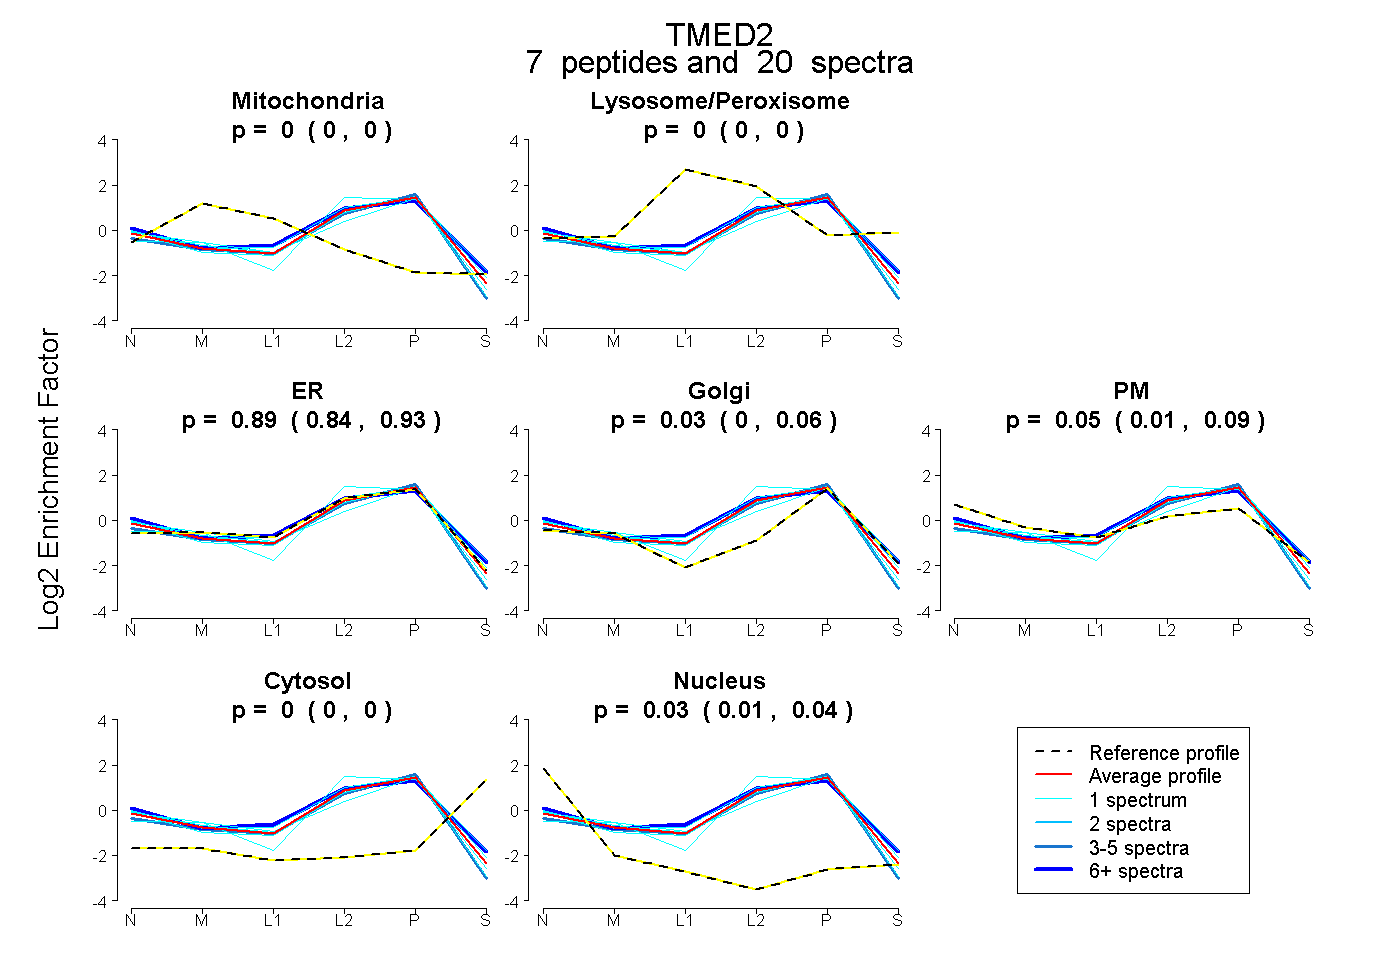 |
0.000
0.000 | 0.000 |
|
0.000
0.000 | 0.000 |
|
0.890
0.838 | 0.931 |
0.030
0.000 | 0.056 |
0.055
0.009 | 0.094 |
0.000
0.000 | 0.000 |
0.025
0.011 | 0.036 |
|
| | | Plot |
|
Lyso |
|
|
|
|
|
|
|
Other |
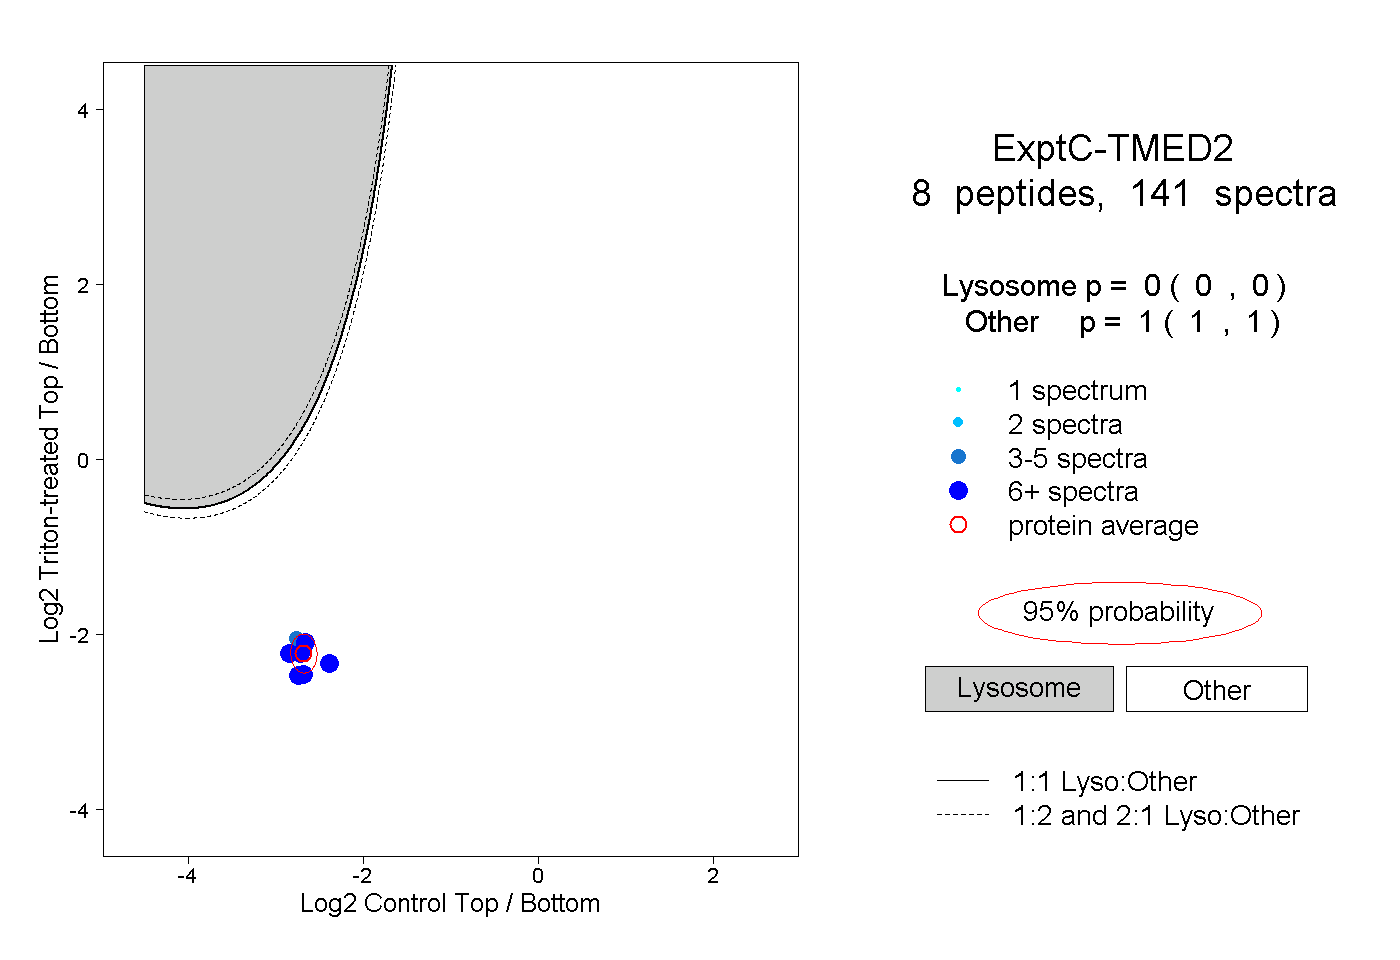
| Expt C |
8
peptides |
141
spectra |
 |
|
0.000
0.000 | 0.000 |
|
|
|
|
|
|
|
1.000
1.000 | 1.000 |
| 19 spectra, HEQEYMEVR |
|
0.000 |
|
|
|
|
|
|
|
1.000 |
| 34 spectra, AINDNTNSR |
|
0.000 |
|
|
|
|
|
|
|
1.000 |
| 9 spectra, FCFSNR |
|
0.000 |
|
|
|
|
|
|
|
1.000 |
| 4 spectra, FFEVR |
|
0.000 |
|
|
|
|
|
|
|
1.000 |
| 16 spectra, GQDMETEAHQNK |
|
0.000 |
|
|
|
|
|
|
|
1.000 |
| 14 spectra, YTFAAHMDGTYK |
|
0.000 |
|
|
|
|
|
|
|
1.000 |
| 9 spectra, MSTMTPK |
|
0.000 |
|
|
|
|
|
|
|
1.000 |
| 36 spectra, VTSGTK |
|
0.000 |
|
|
|
|
|
|
|
1.000 |
| | | Plot |
|
Lyso |
|
|
|
|
|
|
|
Other |
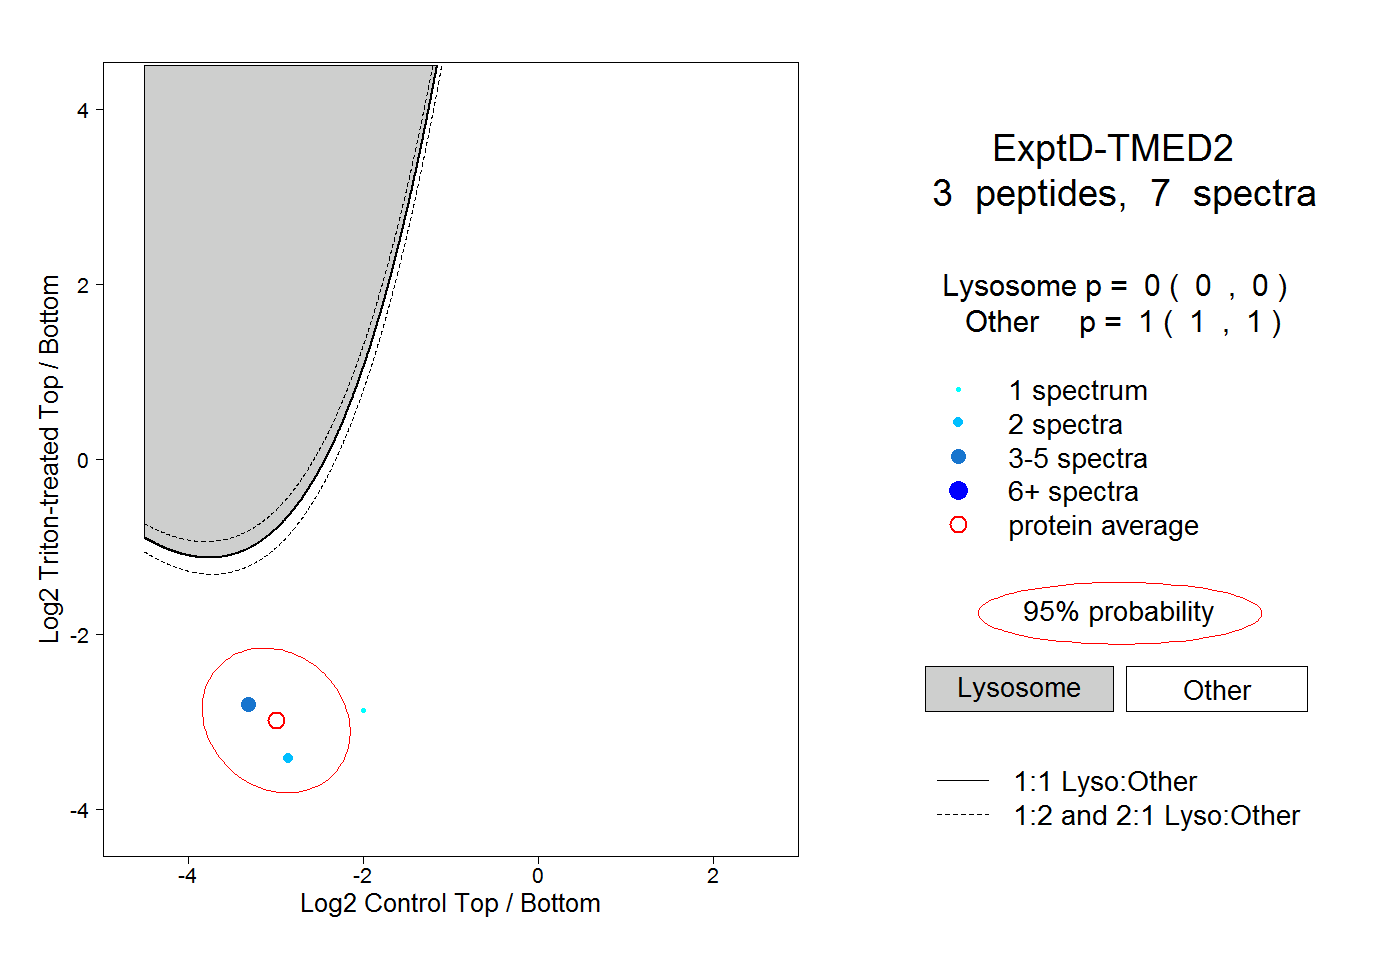
| Expt D |
3
peptides |
7
spectra |
 |
|
0.000
0.000 | 0.000 |
|
|
|
|
|
|
|
1.000
1.000 | 1.000 |