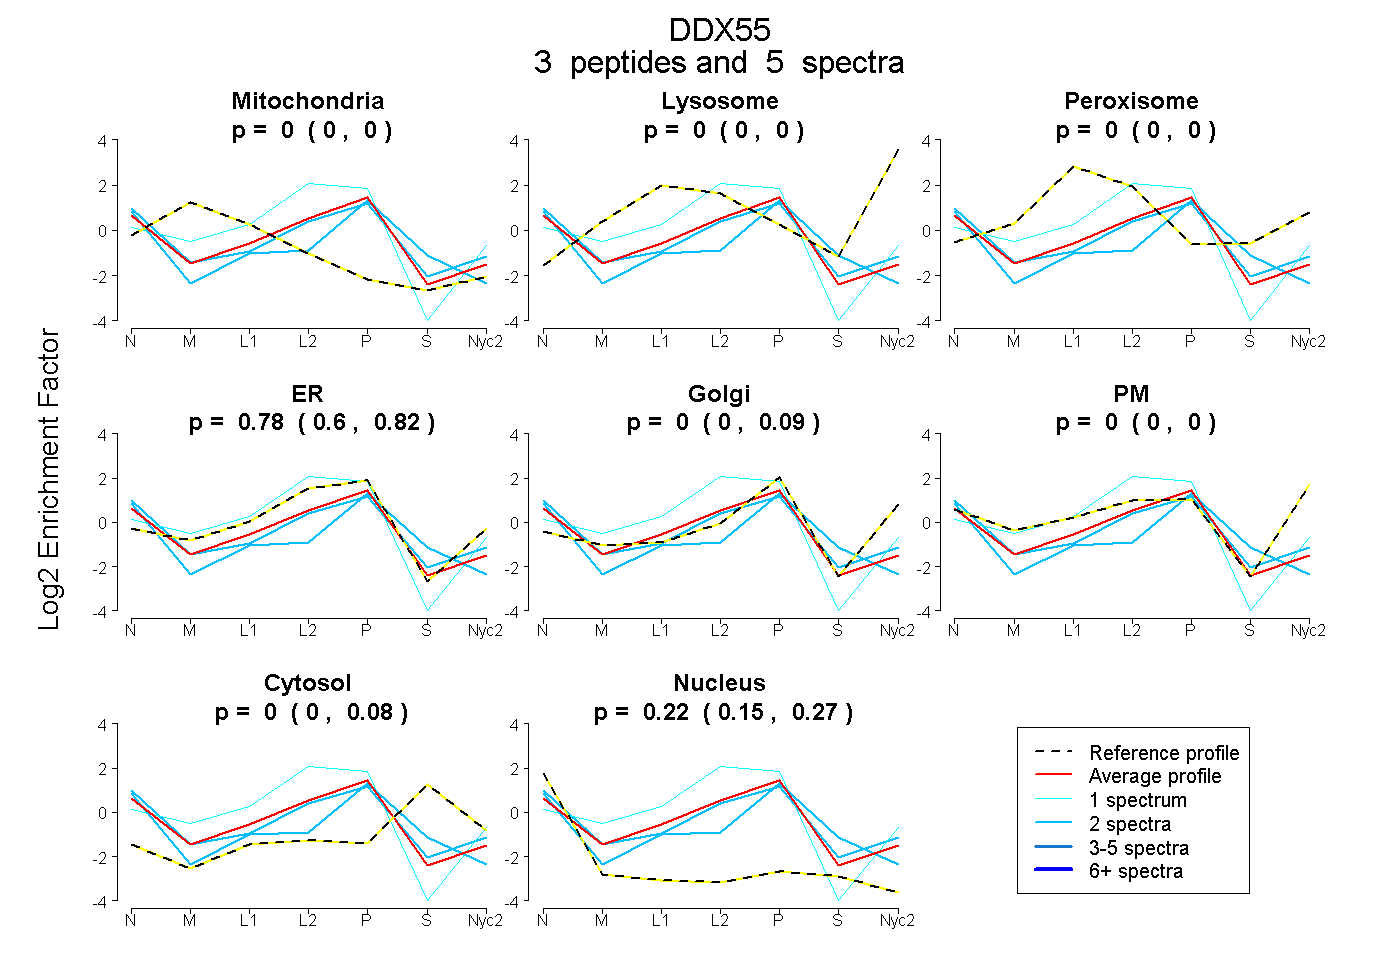
 3
3peptides
spectra
0.000 | 0.000
0.000 | 0.000
0.000 | 0.000
0.604 | 0.821
0.000 | 0.091
0.000 | 0.000
0.000 | 0.081
0.147 | 0.266
1peptide
spectrum
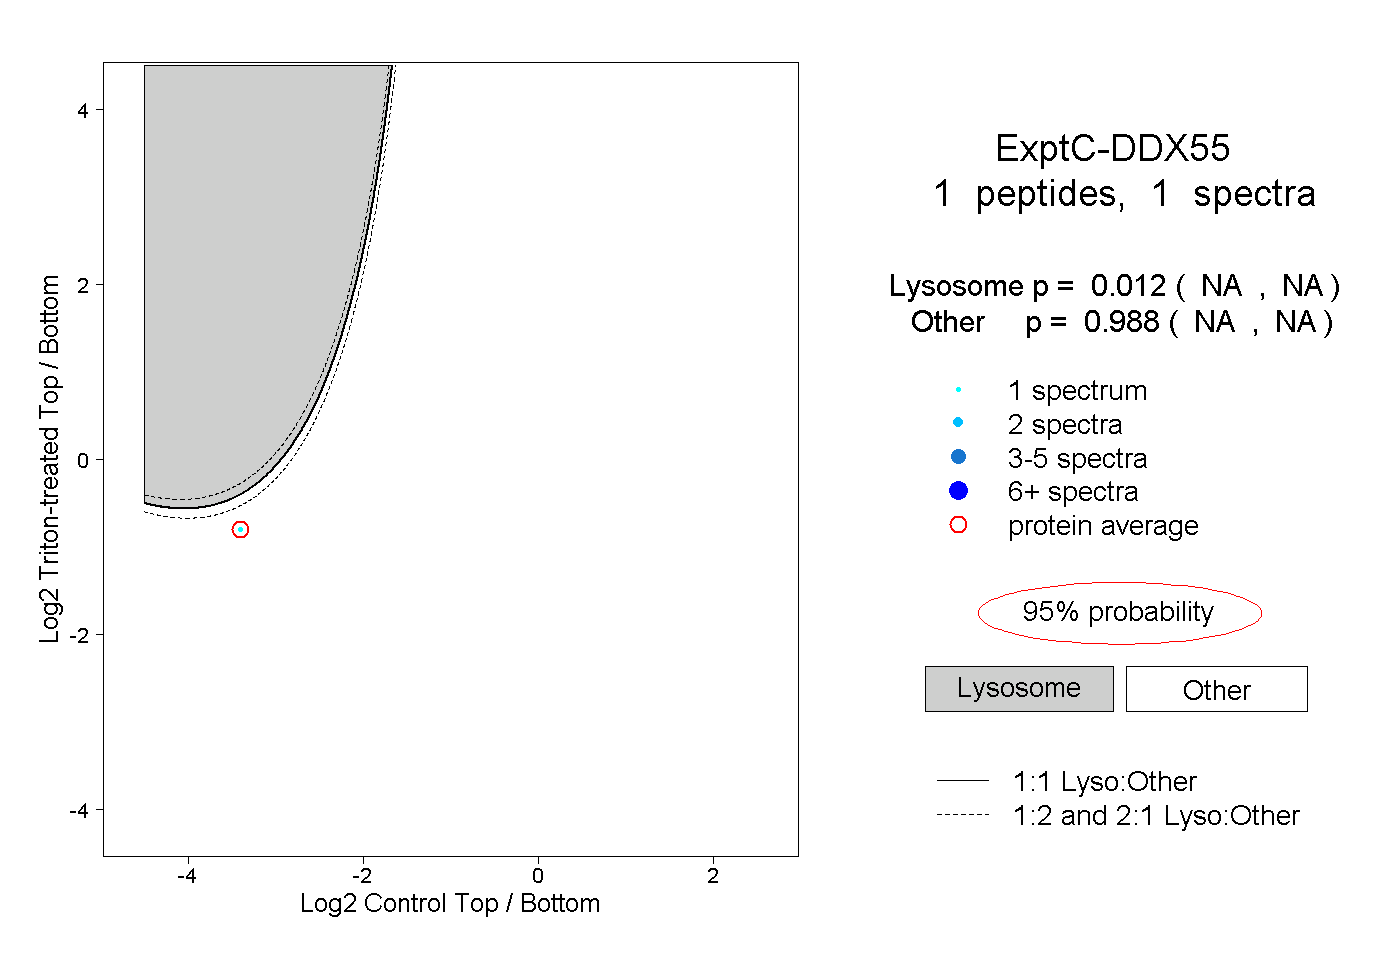
NA | NA
NA | NA
| Plot | Mito | Lyso | Perox | ER | Golgi | PM | Cytosol | Nucleus | |||||
| Expt A |
3 peptides |
5 spectra |
|
0.000 0.000 | 0.000 |
0.000 0.000 | 0.000 |
0.000 0.000 | 0.000 |
0.777 0.604 | 0.821 |
0.000 0.000 | 0.091 |
0.000 0.000 | 0.000 |
0.000 0.000 | 0.081 |
0.223 0.147 | 0.266 |
||
| Plot | Lyso | Other | |||||||||||
| Expt C |
1 peptide |
1 spectrum |
|
0.012 NA | NA |
0.988 NA | NA |