 6
6peptides
spectra
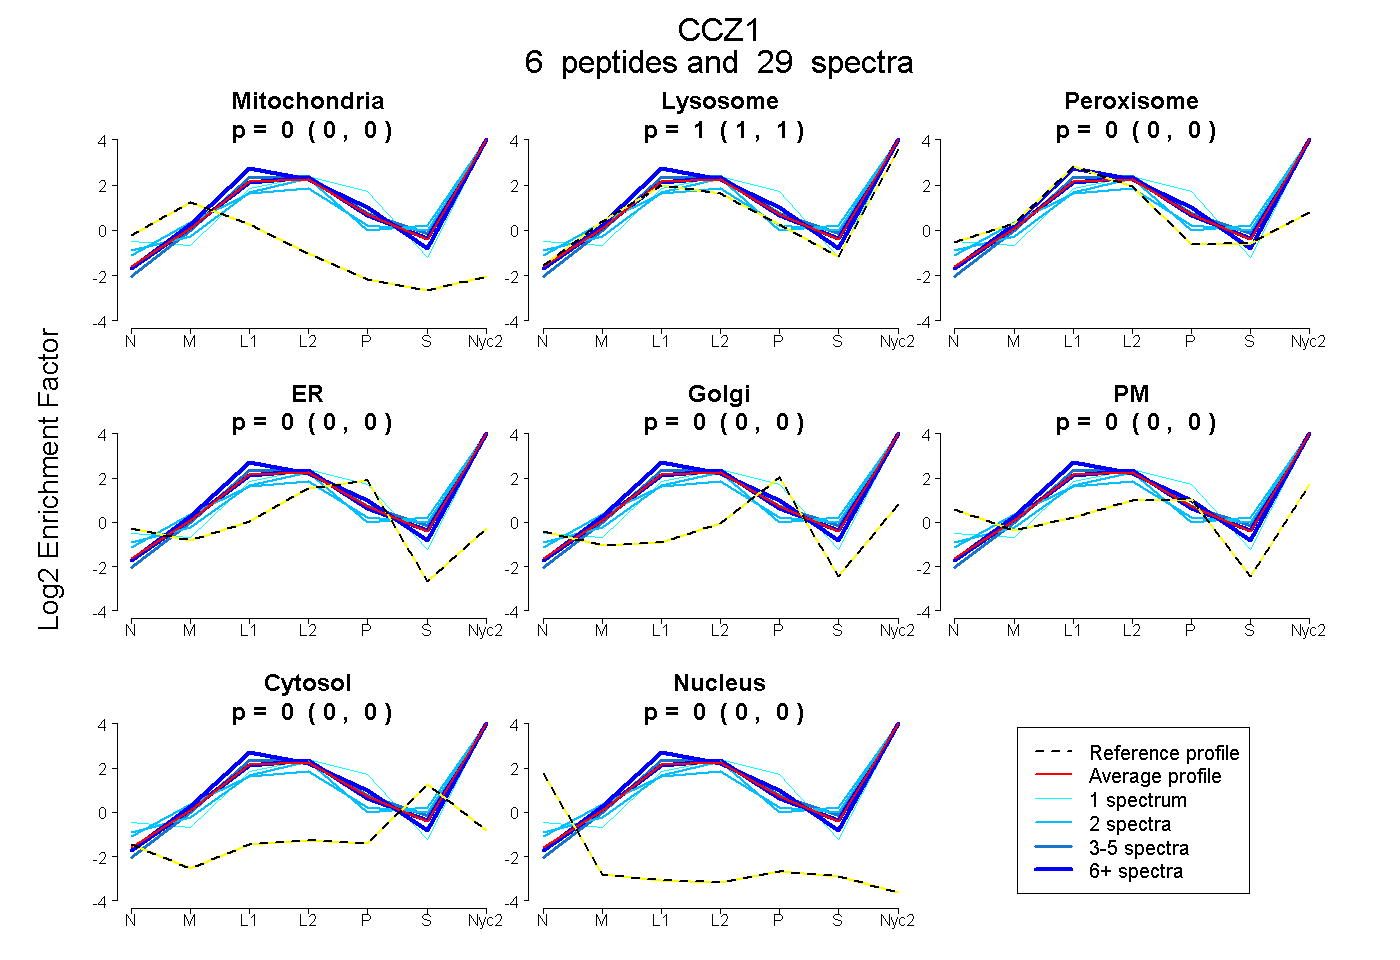
0.000 | 0.000
1.000 | 1.000
0.000 | 0.000
0.000 | 0.000
0.000 | 0.000
0.000 | 0.000
0.000 | 0.000
0.000 | 0.000
4peptides
spectra
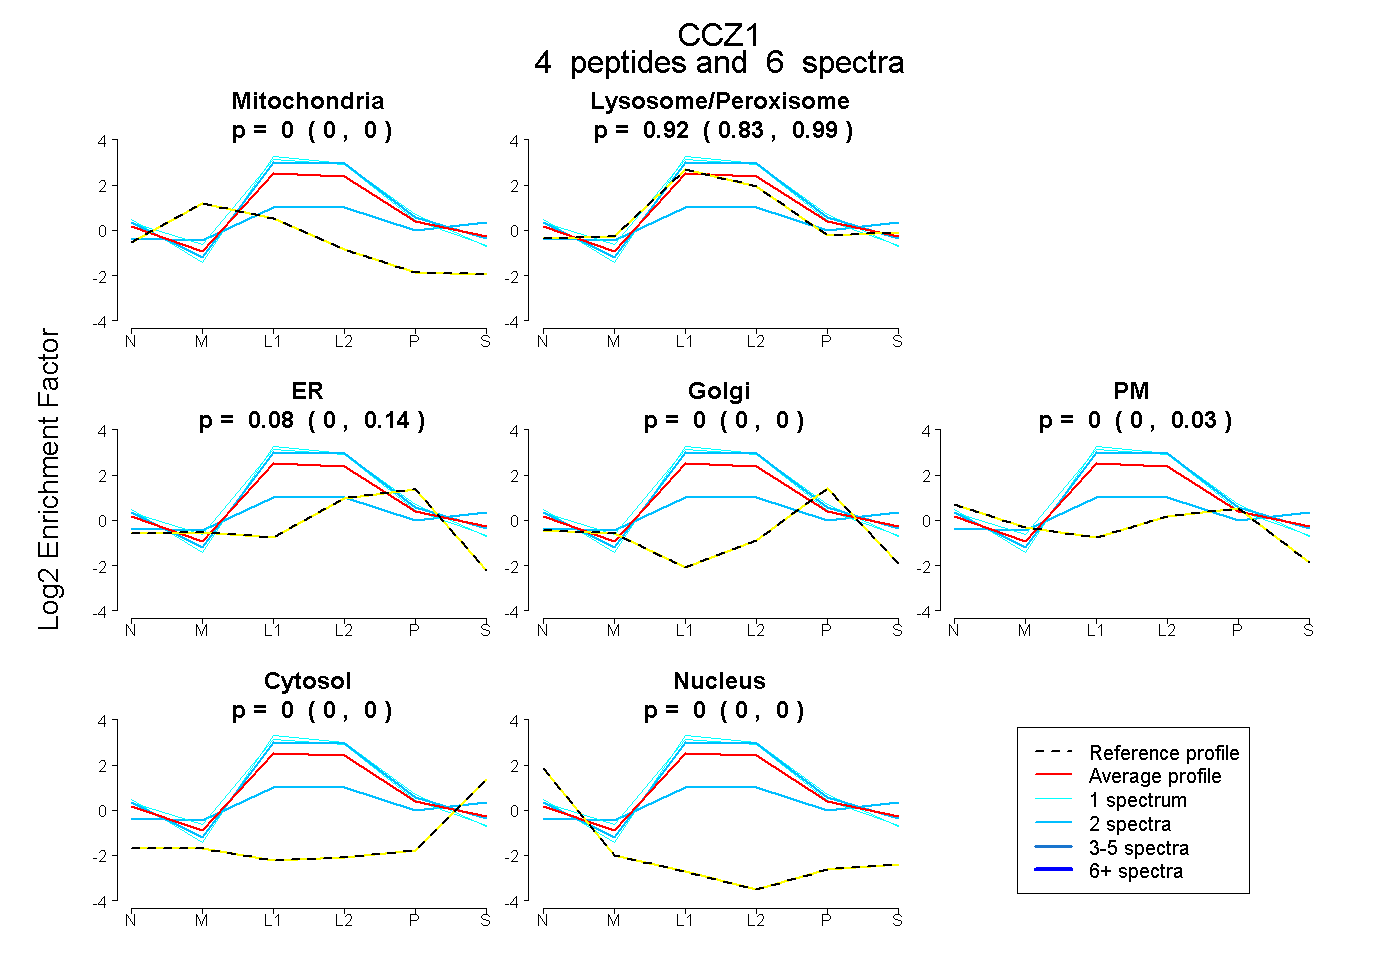
0.000 | 0.000
0.832 | 0.992
0.000 | 0.142
0.000 | 0.000
0.000 | 0.030
0.000 | 0.000
0.000 | 0.000
13peptides
spectra
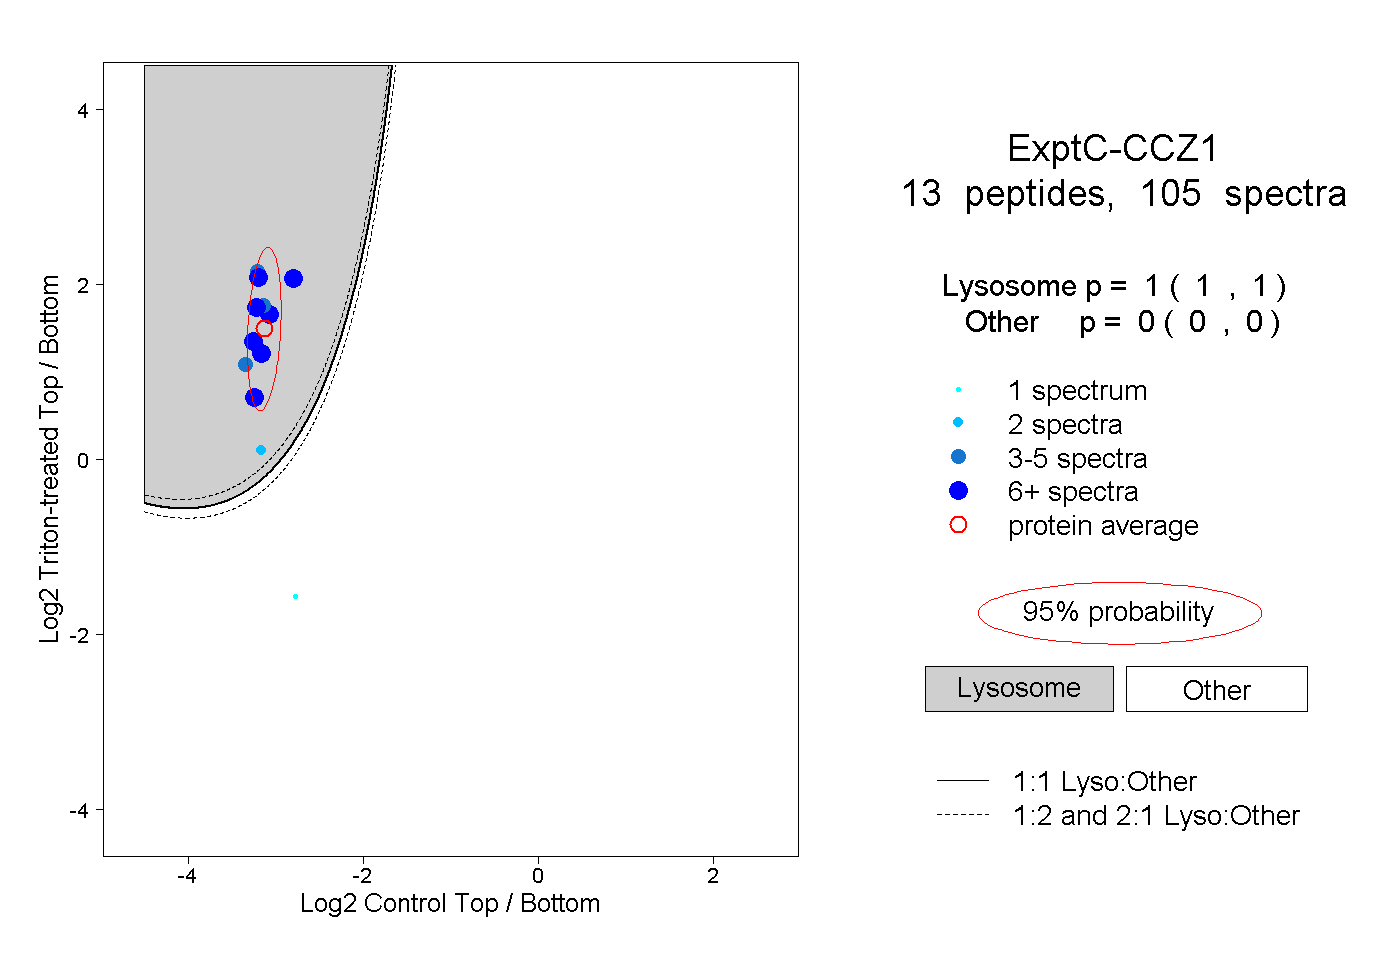
1.000 | 1.000
0.000 | 0.000
2peptides
spectra
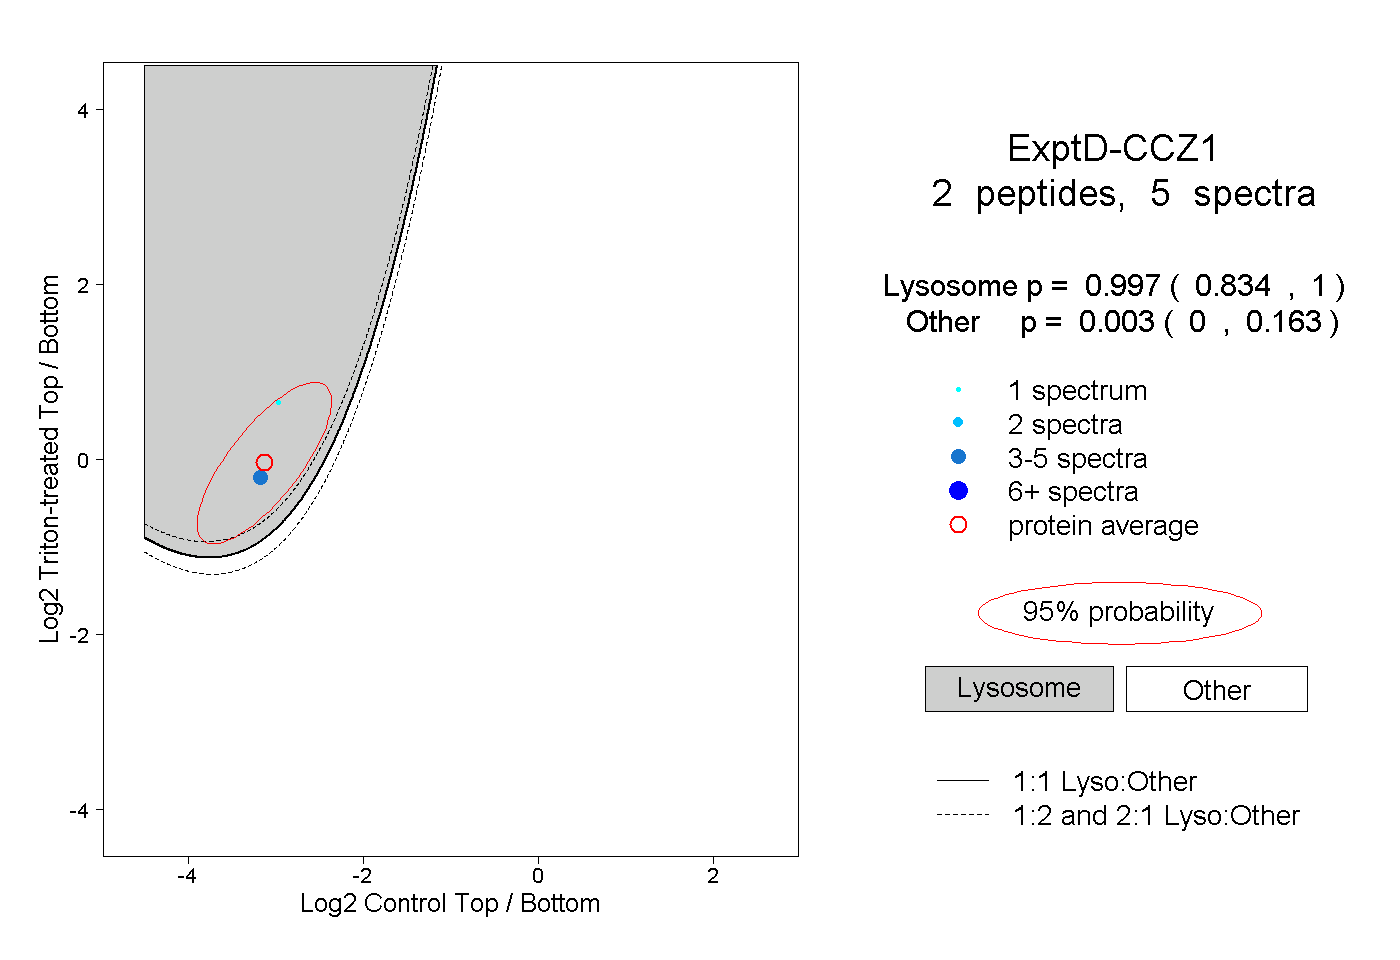
0.834 | 1.000
0.000 | 0.163