 2
2peptides
spectra
0.000 | 0.000
0.492 | 0.799
0.012 | 0.296
0.000 | 0.002
0.000 | 0.094
0.000 | 0.249
0.000 | 0.000
0.000 | 0.000
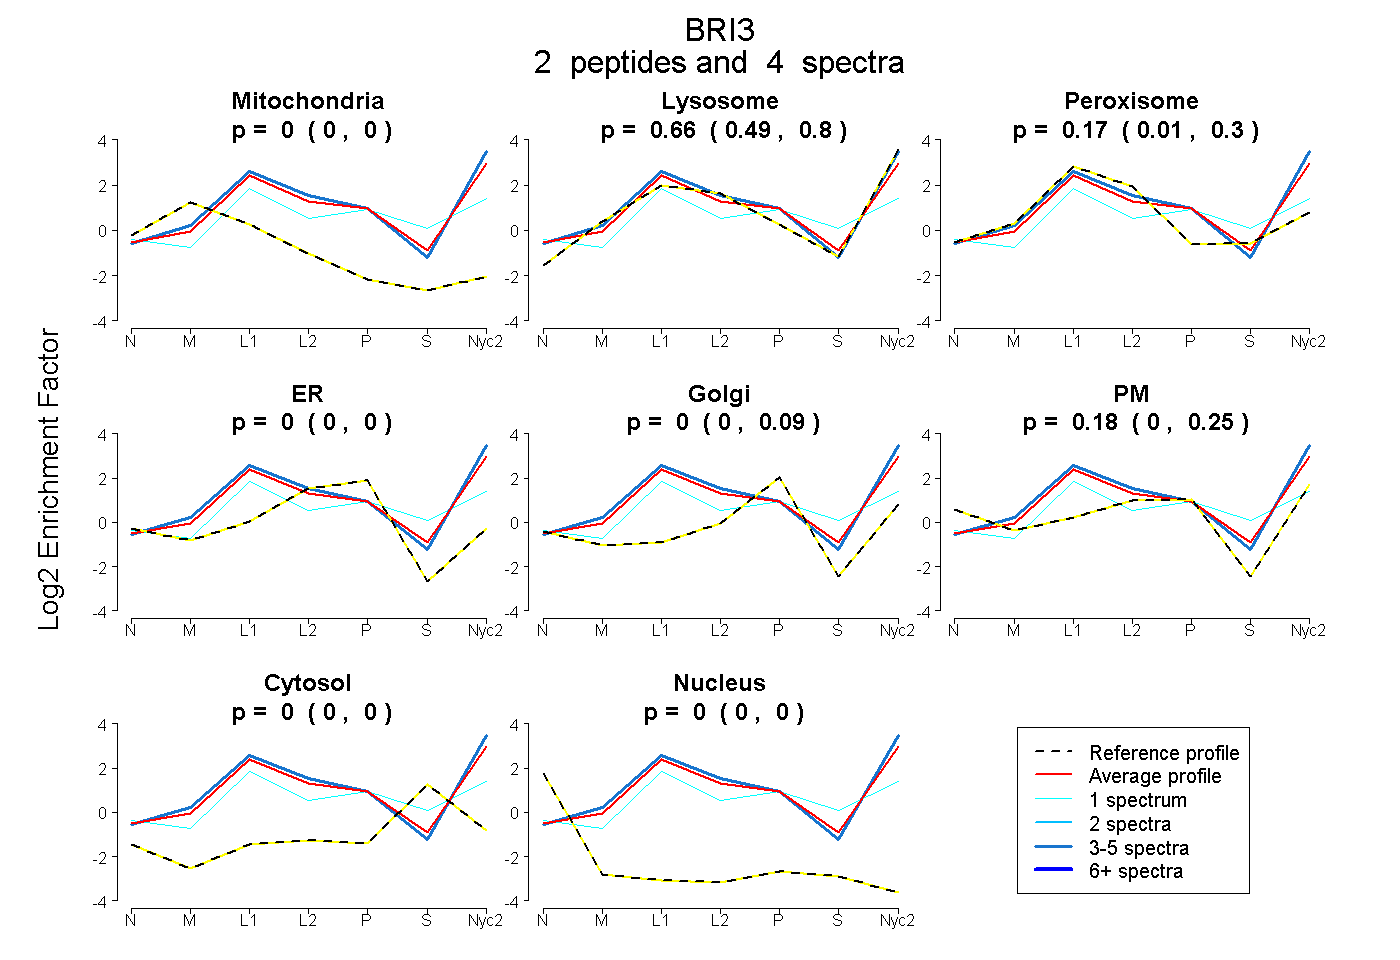
| Plot | Mito | Lyso | Perox | ER | Golgi | PM | Cytosol | Nucleus | |||||
| Expt A |
2 peptides |
4 spectra |
|
0.000 0.000 | 0.000 |
0.658 0.492 | 0.799 |
0.166 0.012 | 0.296 |
0.000 0.000 | 0.002 |
0.000 0.000 | 0.094 |
0.176 0.000 | 0.249 |
0.000 0.000 | 0.000 |
0.000 0.000 | 0.000 |
| 1 spectrum, YPANSIVVVGGCPVCR | 0.000 | 0.233 | 0.421 | 0.000 | 0.197 | 0.000 | 0.150 | 0.000 | ||
| 3 spectra, VYNIHSR | 0.000 | 0.830 | 0.048 | 0.000 | 0.000 | 0.121 | 0.000 | 0.000 |
| Plot | Mito | Lyso or Perox | ER | Golgi | PM | Cytosol | Nucleus | ||||||
| Expt B |
1 peptide |
2 spectra |
 |
0.000 NA | NA |
0.490 NA | NA |
0.000 NA | NA |
0.000 NA | NA |
0.328 NA | NA |
0.137 NA | NA |
0.045 NA | NA |
|||
| Plot | Lyso | Other | |||||||||||
| Expt C |
2 peptides |
4 spectra |
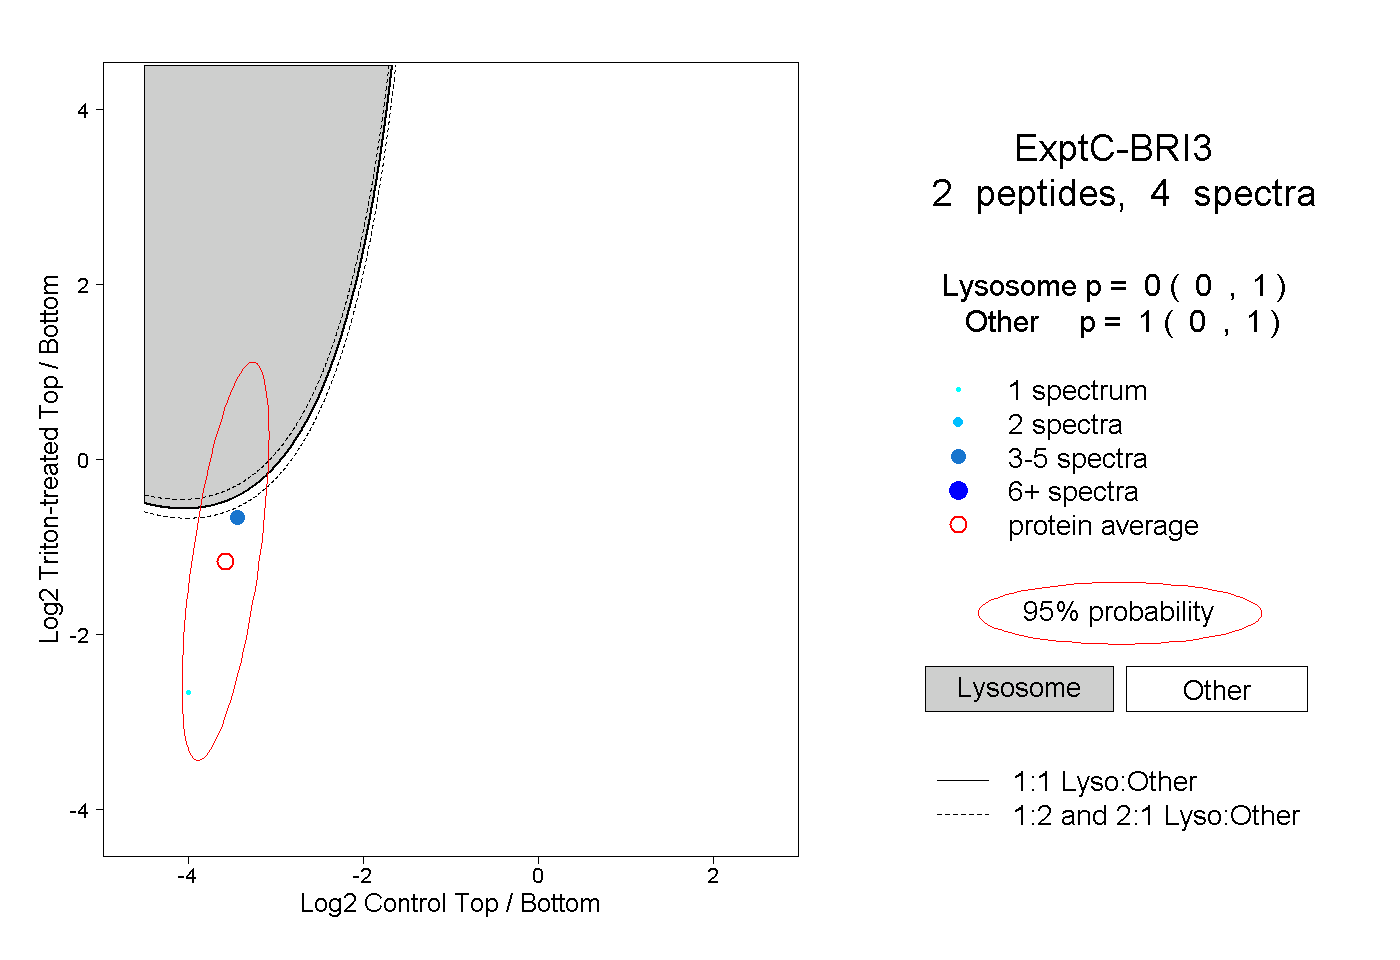 |
0.000 0.000 | 1.000 |
1.000 0.000 | 1.000 |