11
11peptides
spectra
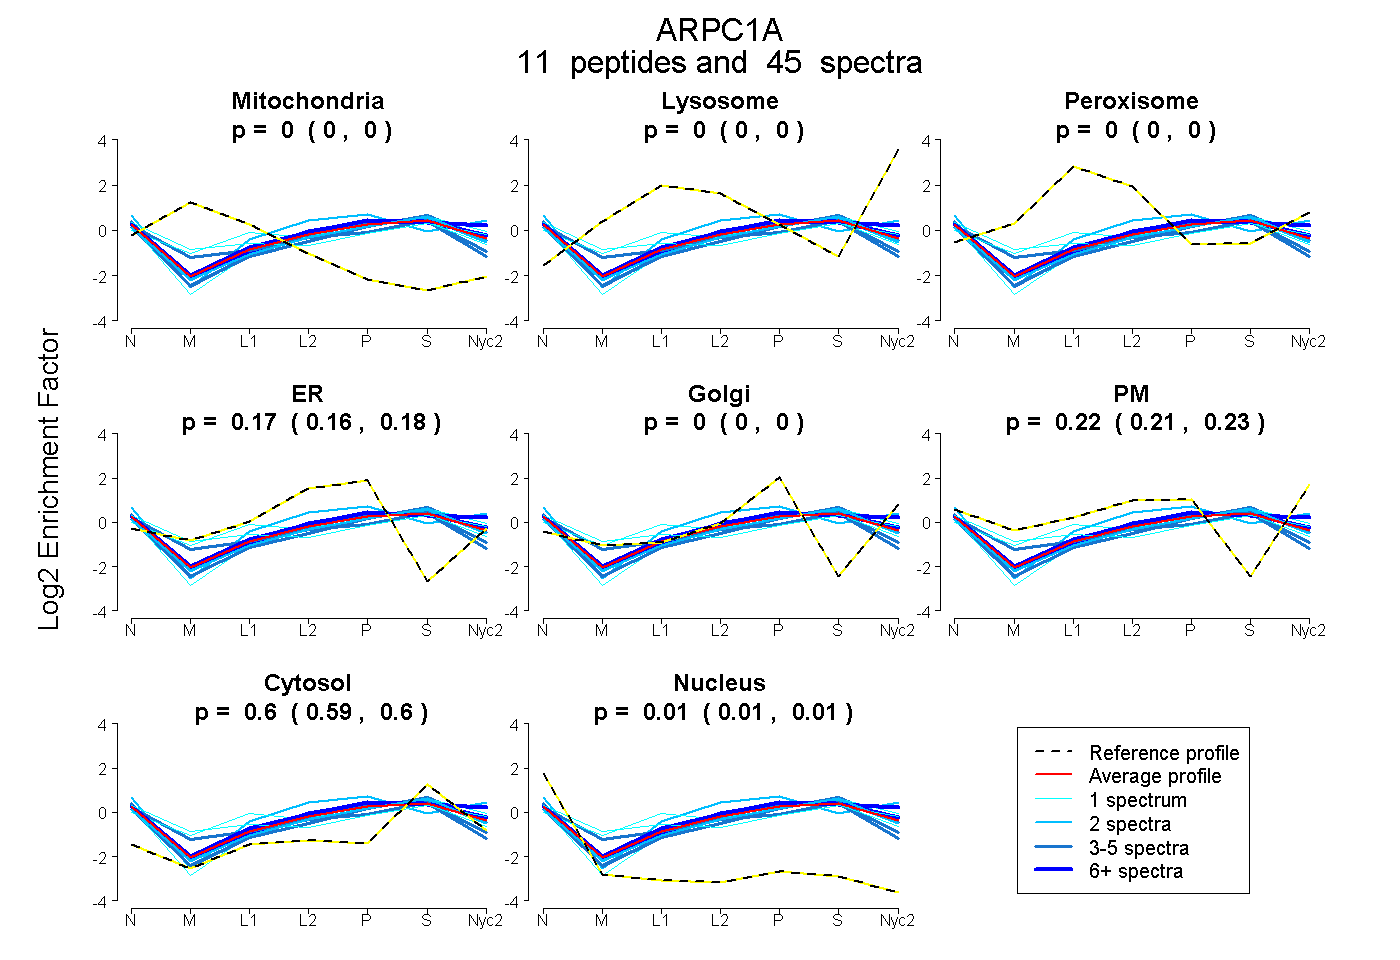
0.000 | 0.000
0.000 | 0.000
0.000 | 0.000
0.158 | 0.183
0.000 | 0.000
0.206 | 0.234
0.595 | 0.601
0.005 | 0.012
5peptides
spectra
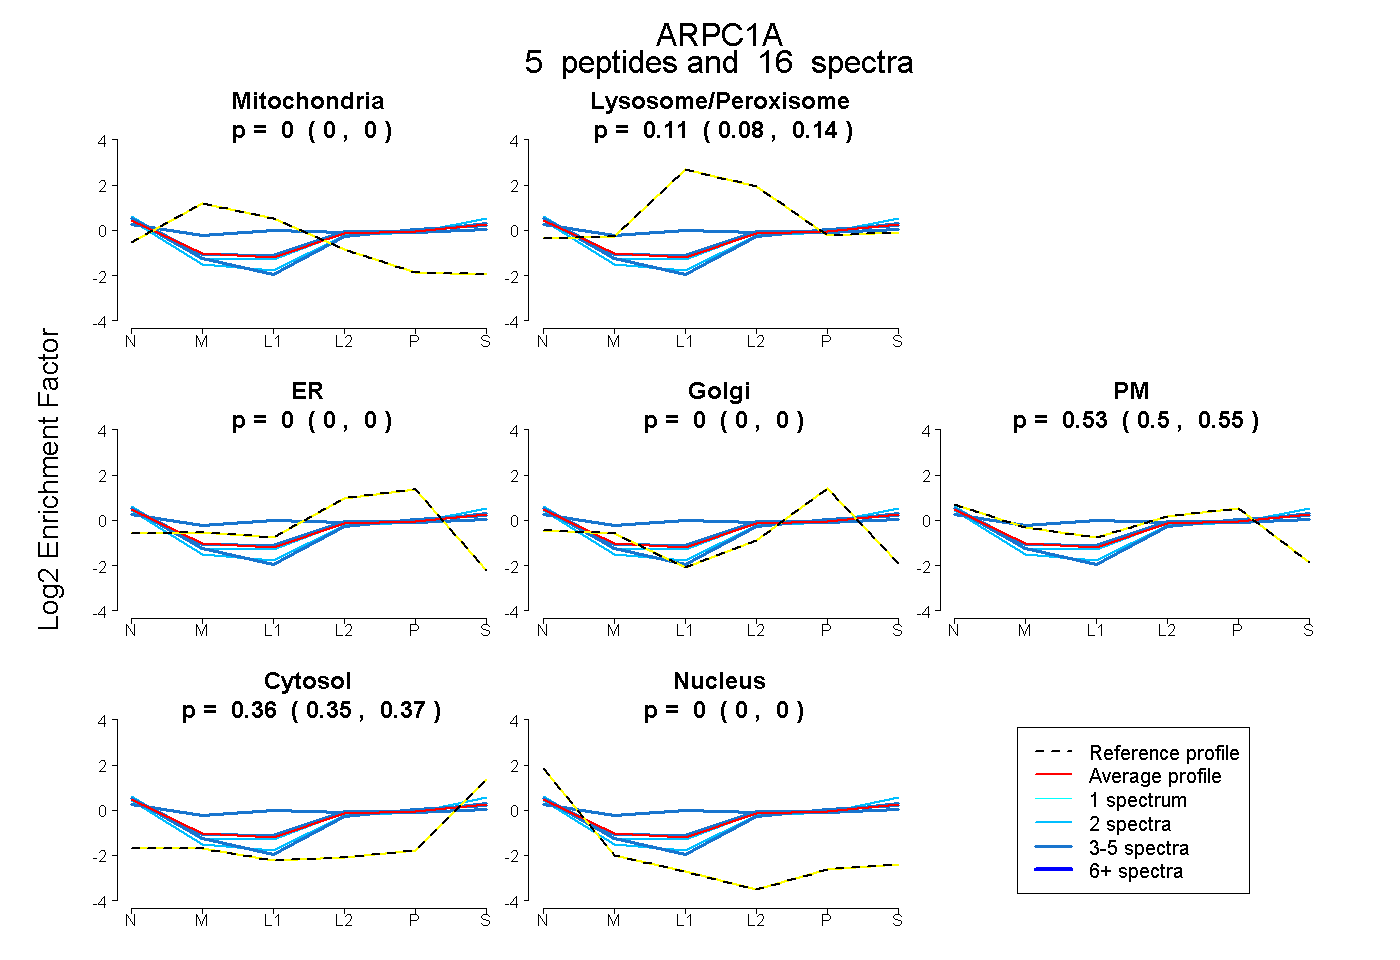
0.000 | 0.000
0.078 | 0.136
0.000 | 0.000
0.000 | 0.000
0.505 | 0.550
0.350 | 0.372
0.000 | 0.000