 11
11peptides
spectra
0.000 | 0.000
0.000 | 0.000
0.000 | 0.000
0.158 | 0.183
0.000 | 0.000
0.206 | 0.234
0.595 | 0.601
0.005 | 0.012
| Plot | Mito | Lyso | Perox | ER | Golgi | PM | Cytosol | Nucleus | |||||
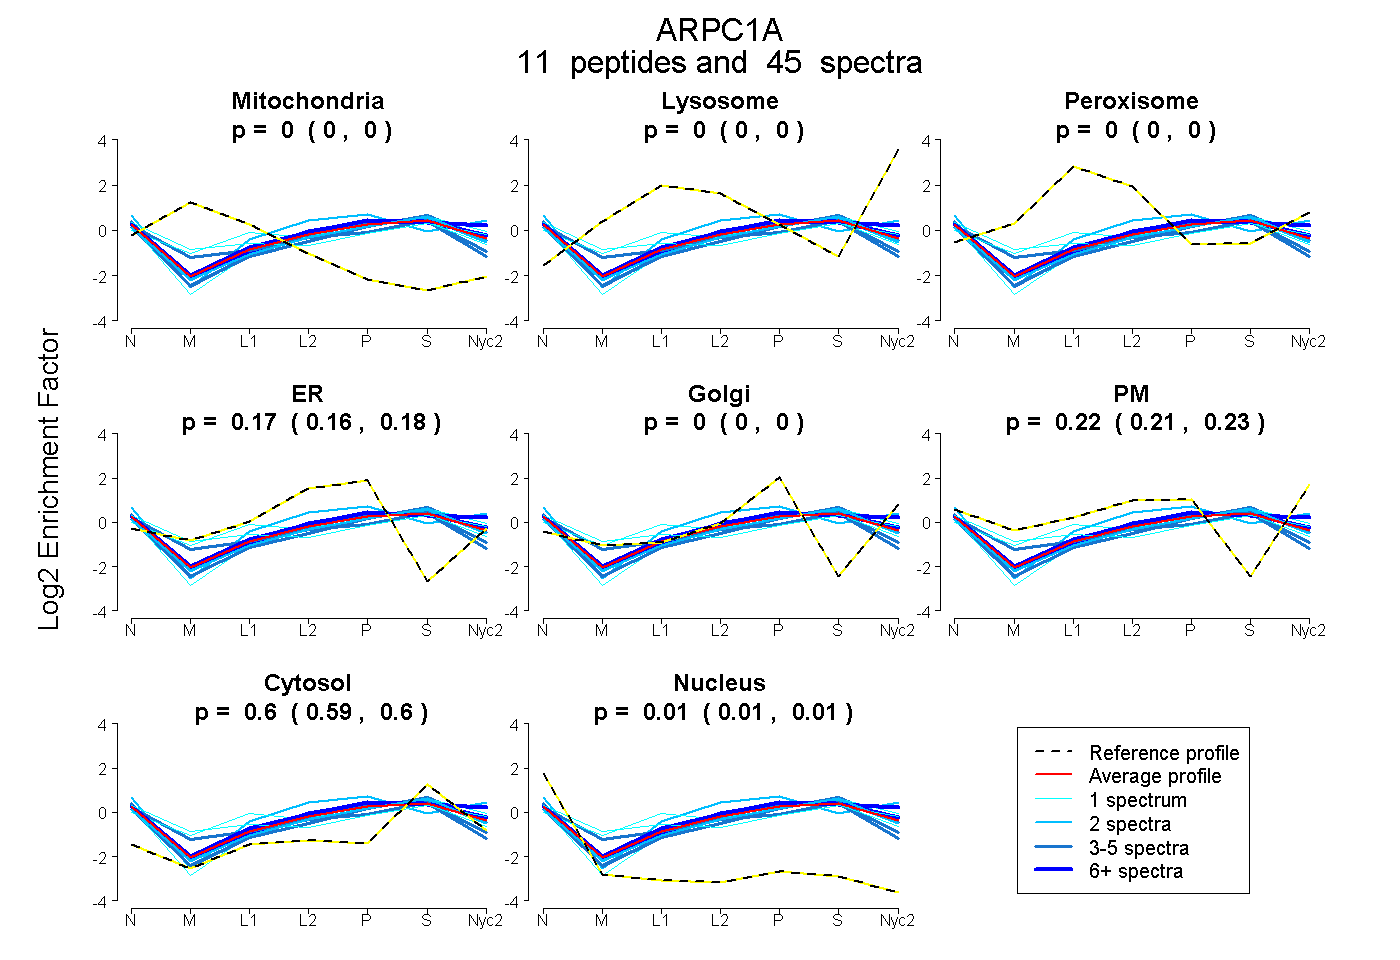
| Expt A |
11 peptides |
45 spectra |
|
0.000 0.000 | 0.000 |
0.000 0.000 | 0.000 |
0.000 0.000 | 0.000 |
0.171 0.158 | 0.183 |
0.000 0.000 | 0.000 |
0.222 0.206 | 0.234 |
0.598 0.595 | 0.601 |
0.008 0.005 | 0.012 |
| 1 spectrum, LISVCYFESENDWWVSK | 0.000 | 0.000 | 0.221 | 0.164 | 0.136 | 0.000 | 0.454 | 0.025 | ||
| 10 spectra, FAVGSGAR | 0.000 | 0.000 | 0.000 | 0.182 | 0.000 | 0.238 | 0.581 | 0.000 | ||
| 2 spectra, AATFVK | 0.000 | 0.000 | 0.000 | 0.225 | 0.000 | 0.140 | 0.627 | 0.008 | ||
| 5 spectra, DGIWKPTLVILR | 0.000 | 0.000 | 0.000 | 0.108 | 0.076 | 0.131 | 0.668 | 0.017 | ||
| 4 spectra, IVTCGADR | 0.000 | 0.000 | 0.000 | 0.345 | 0.000 | 0.000 | 0.577 | 0.078 | ||
| 1 spectrum, SVQVSTLR | 0.053 | 0.000 | 0.062 | 0.000 | 0.000 | 0.342 | 0.514 | 0.030 | ||
| 2 spectra, ATTEDR | 0.000 | 0.000 | 0.000 | 0.111 | 0.000 | 0.439 | 0.451 | 0.000 | ||
| 2 spectra, WSPLENK | 0.000 | 0.000 | 0.000 | 0.169 | 0.000 | 0.166 | 0.657 | 0.008 | ||
| 1 spectrum, EVDEKPASTPWGSK | 0.000 | 0.000 | 0.000 | 0.072 | 0.045 | 0.227 | 0.657 | 0.000 | ||
| 14 spectra, NMSAMER | 0.000 | 0.000 | 0.000 | 0.032 | 0.027 | 0.392 | 0.549 | 0.000 | ||
| 3 spectra, GCLTFVSK | 0.000 | 0.000 | 0.104 | 0.190 | 0.000 | 0.091 | 0.534 | 0.081 |
| Plot | Mito | Lyso or Perox | ER | Golgi | PM | Cytosol | Nucleus | ||||||
| Expt B |
5 peptides |
16 spectra |
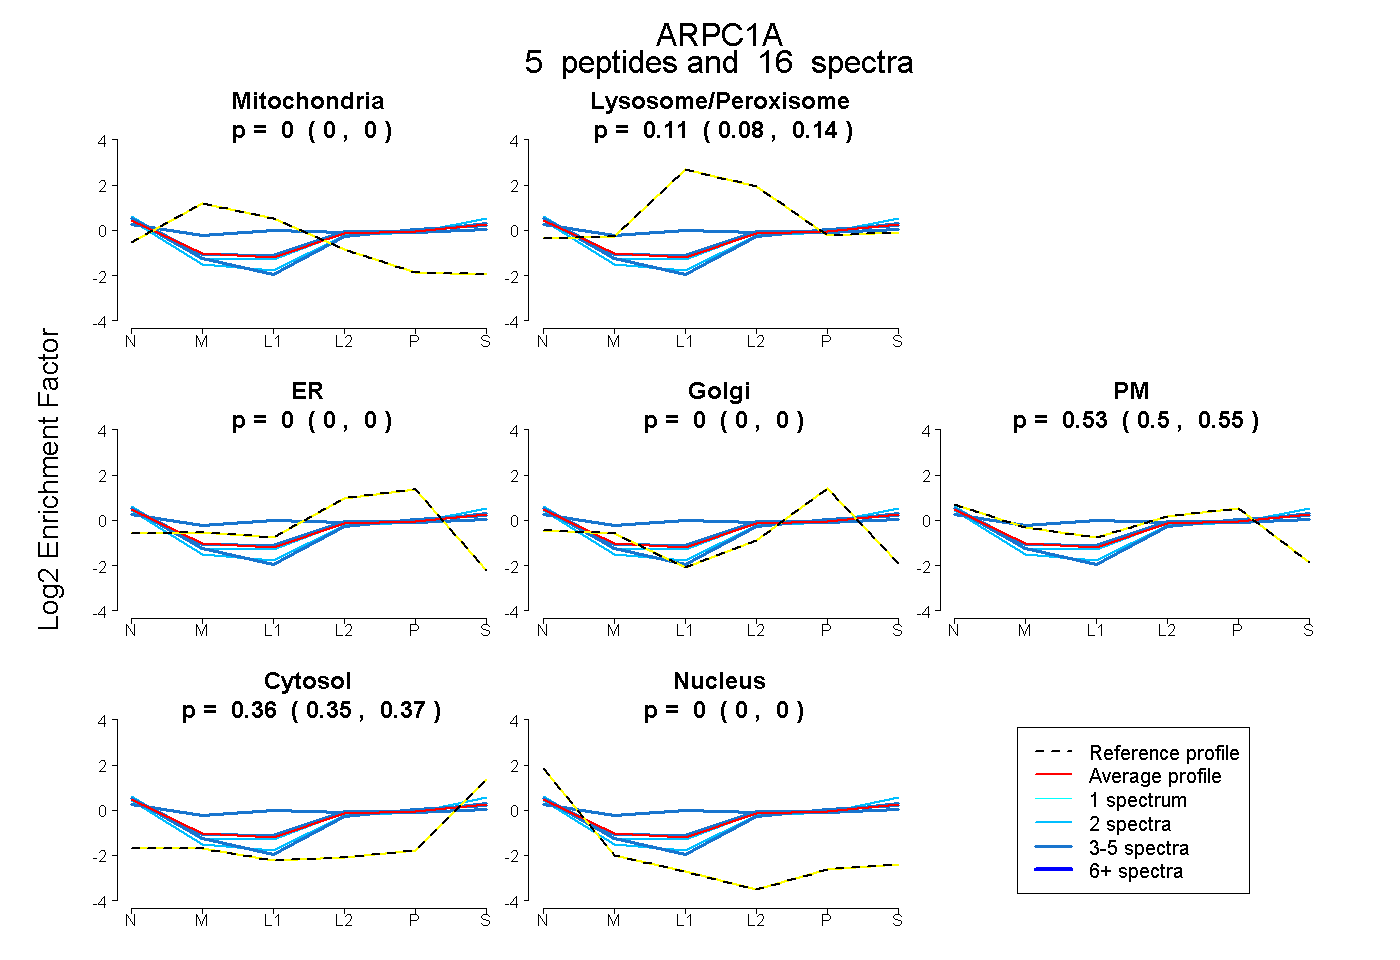 |
0.000 0.000 | 0.000 |
0.109 0.078 | 0.136 |
0.000 0.000 | 0.000 |
0.000 0.000 | 0.000 |
0.530 0.505 | 0.550 |
0.362 0.350 | 0.372 |
0.000 0.000 | 0.000 |
|||
| Plot | Lyso | Other | |||||||||||
| Expt C |
10 peptides |
48 spectra |
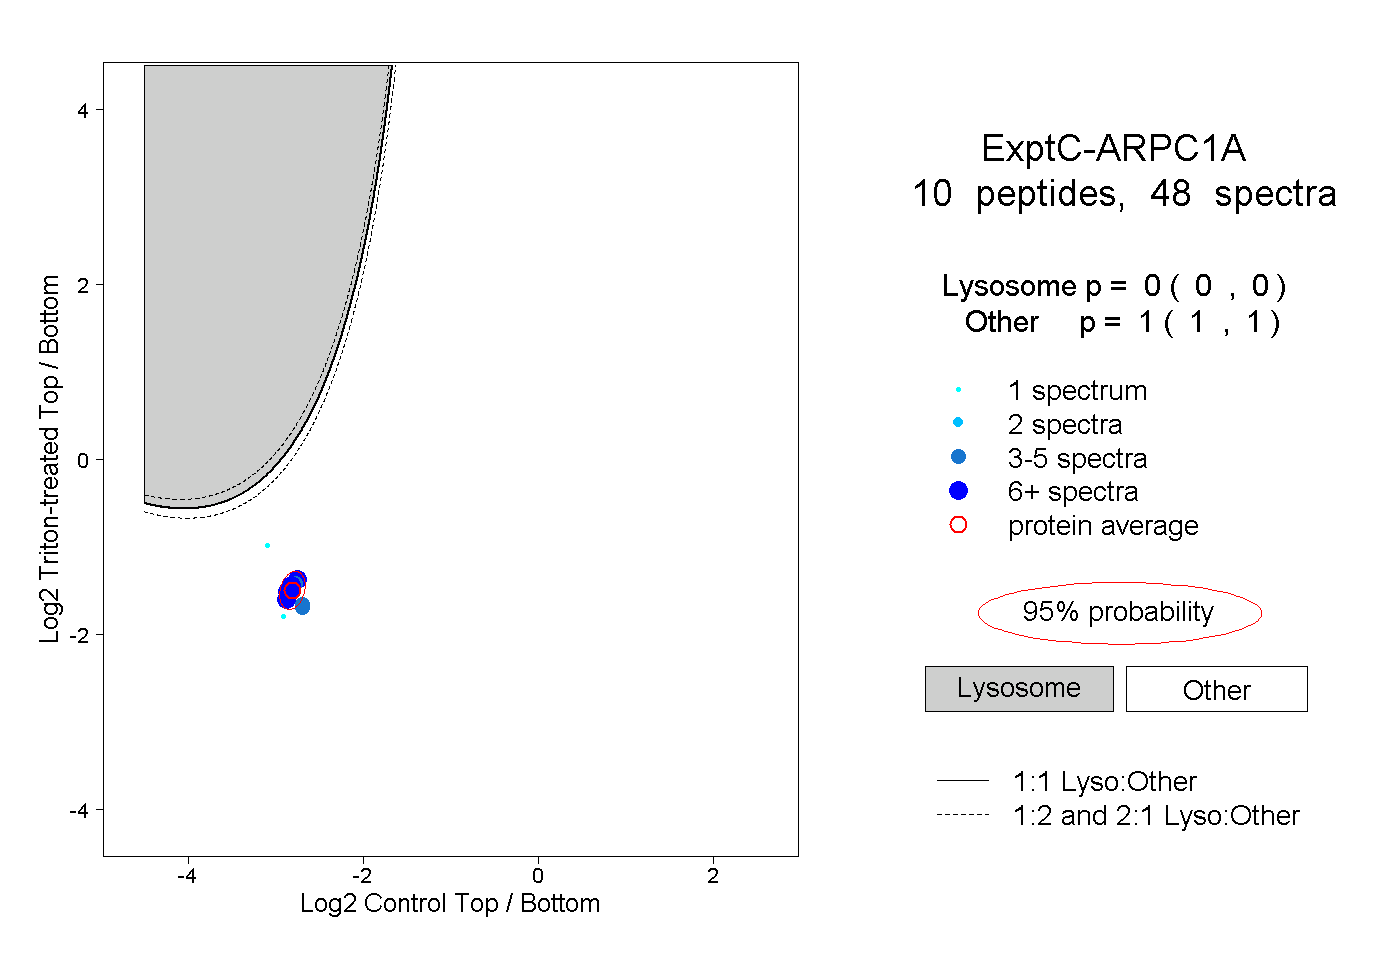 |
0.000 0.000 | 0.000 |
1.000 1.000 | 1.000 |
||||||||
| Plot | Lyso | Other | |||||||||||
| Expt D |
4 peptides |
8 spectra |
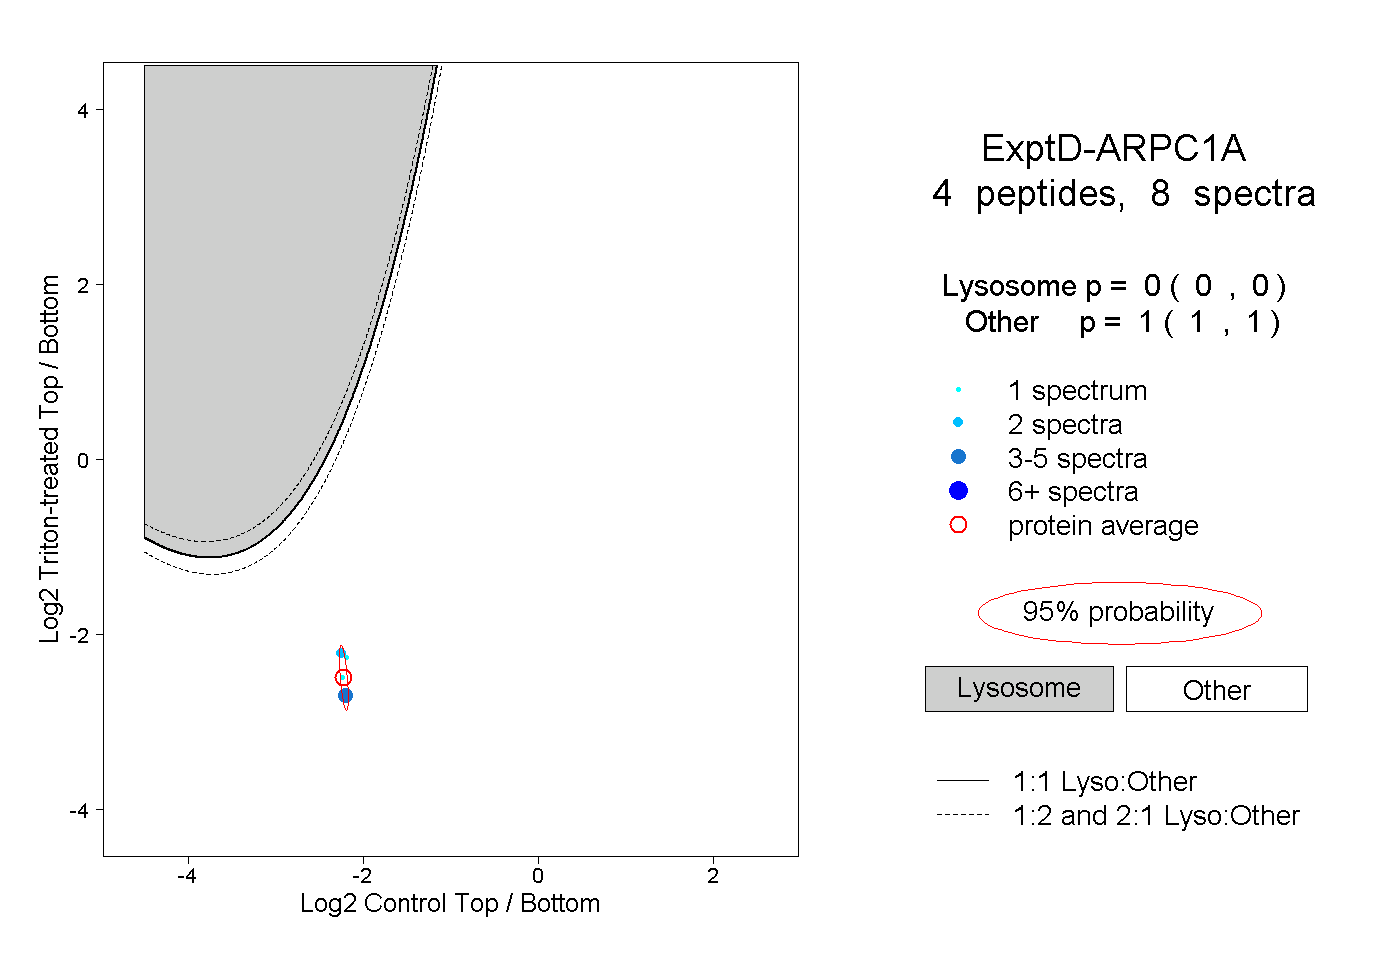 |
0.000 0.000 | 0.000 |
1.000 1.000 | 1.000 |