 6
6peptides
spectra
0.000 | 0.052
0.000 | 0.000
0.000 | 0.035
0.744 | 0.861
0.029 | 0.139
0.000 | 0.079
0.000 | 0.055
0.000 | 0.041
6peptides
spectra
0.000 | 0.000
1.000 | 1.000
| Plot | Mito | Lyso | Perox | ER | Golgi | PM | Cytosol | Nucleus | |||||
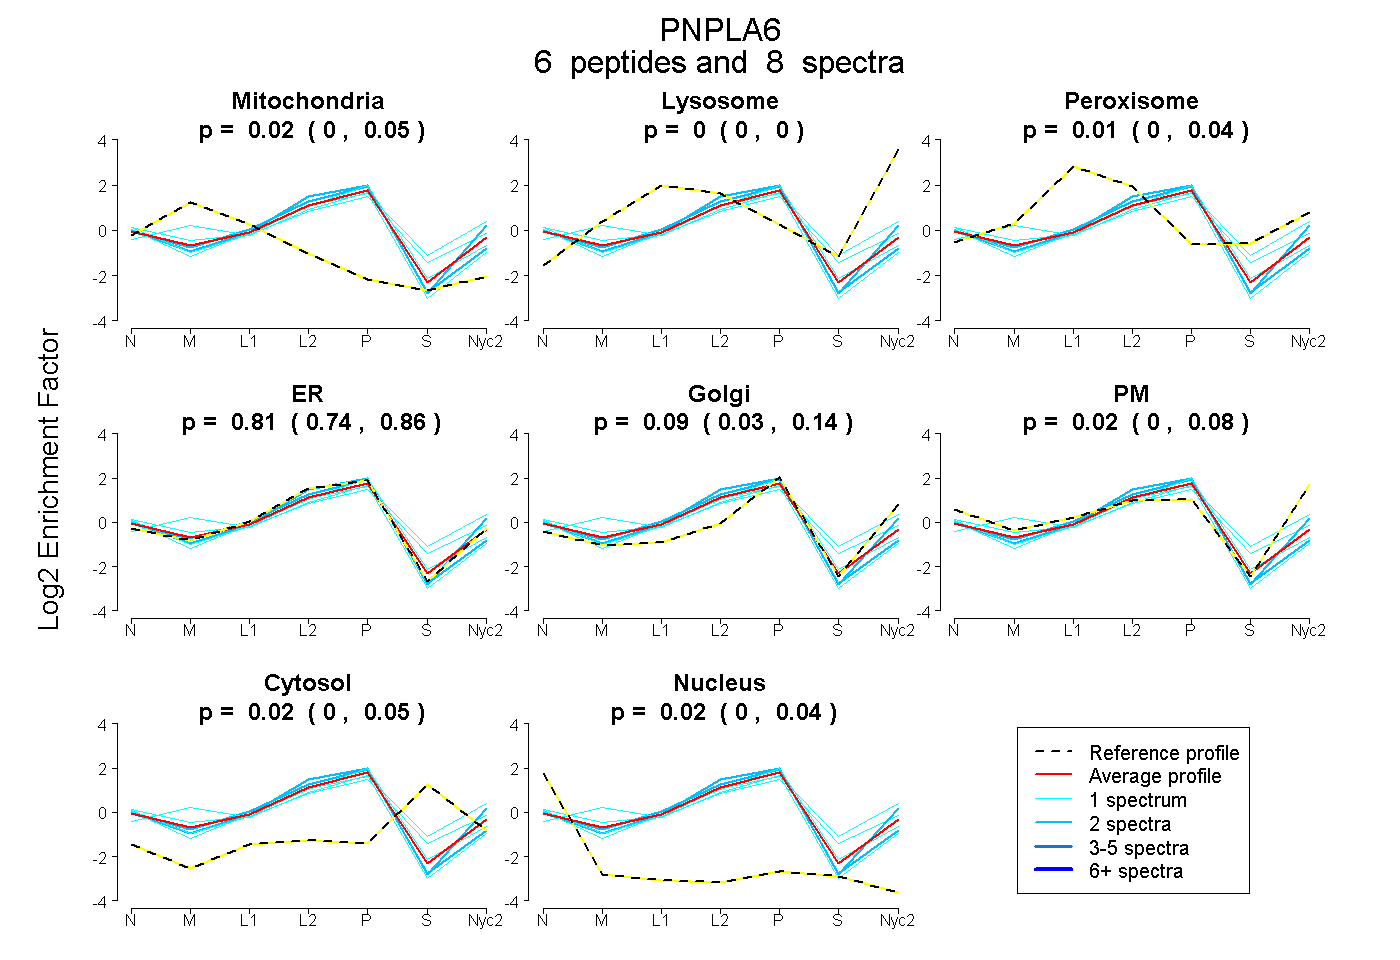
| Expt A |
6 peptides |
8 spectra |
|
0.020 0.000 | 0.052 |
0.000 0.000 | 0.000 |
0.013 0.000 | 0.035 |
0.806 0.744 | 0.861 |
0.095 0.029 | 0.139 |
0.024 0.000 | 0.079 |
0.019 0.000 | 0.055 |
0.022 0.000 | 0.041 |
||
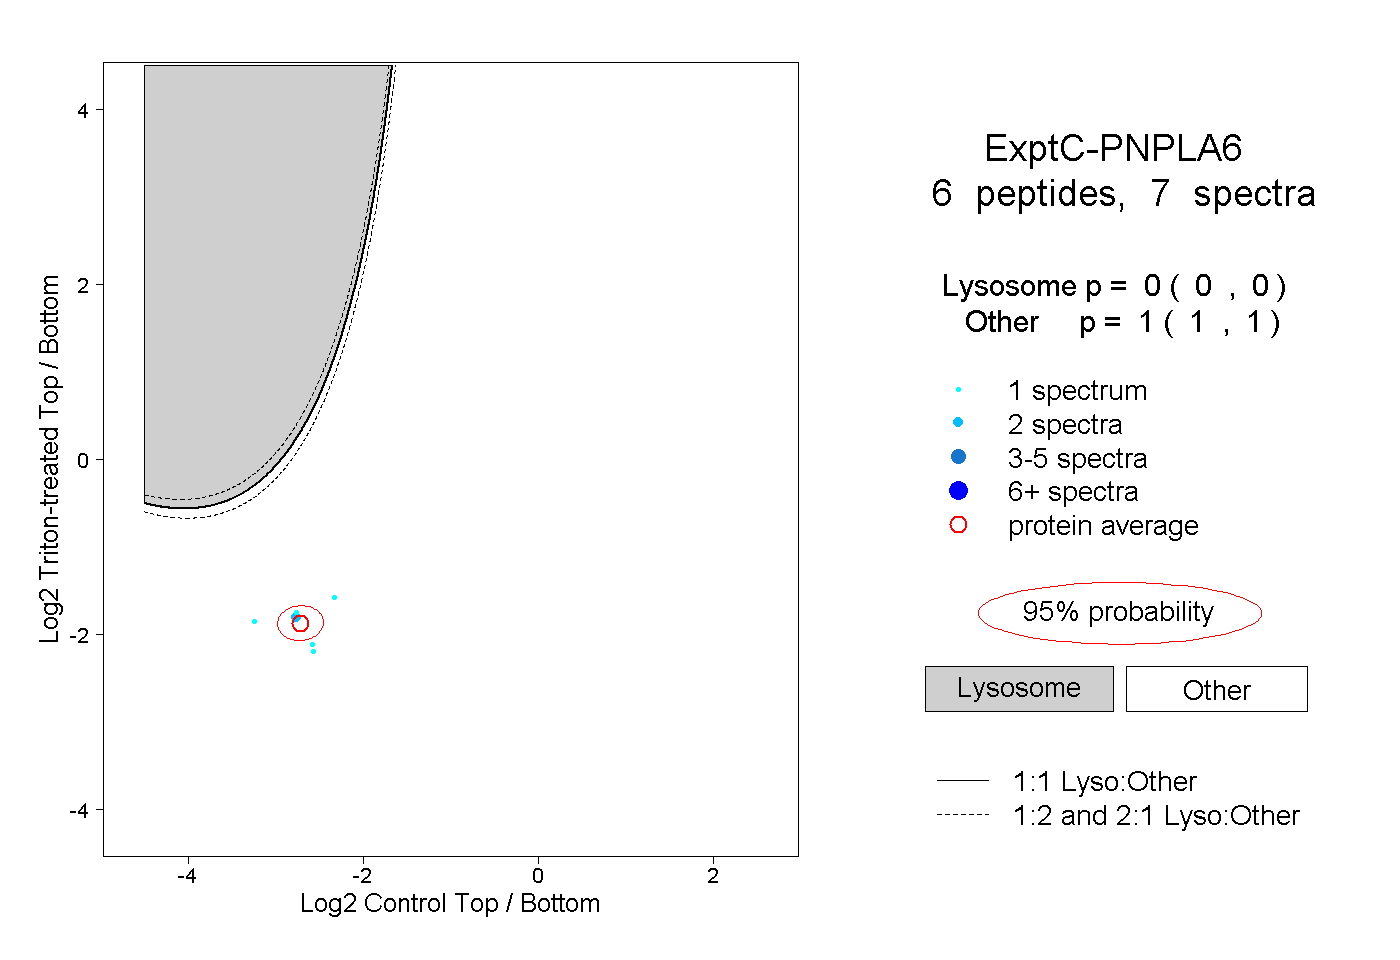
| Plot | Lyso | Other | |||||||||||
| Expt C |
6 peptides |
7 spectra |
|
0.000 0.000 | 0.000 |
1.000 1.000 | 1.000 |