 1
1peptide
spectra
NA | NA
NA | NA
NA | NA
NA | NA
NA | NA
NA | NA
NA | NA
NA | NA
3peptides
spectra
0.000 | 1.000
0.000 | 1.000
1peptide
spectrum
NA | NA
NA | NA
| Plot | Mito | Lyso | Perox | ER | Golgi | PM | Cytosol | Nucleus | |||||
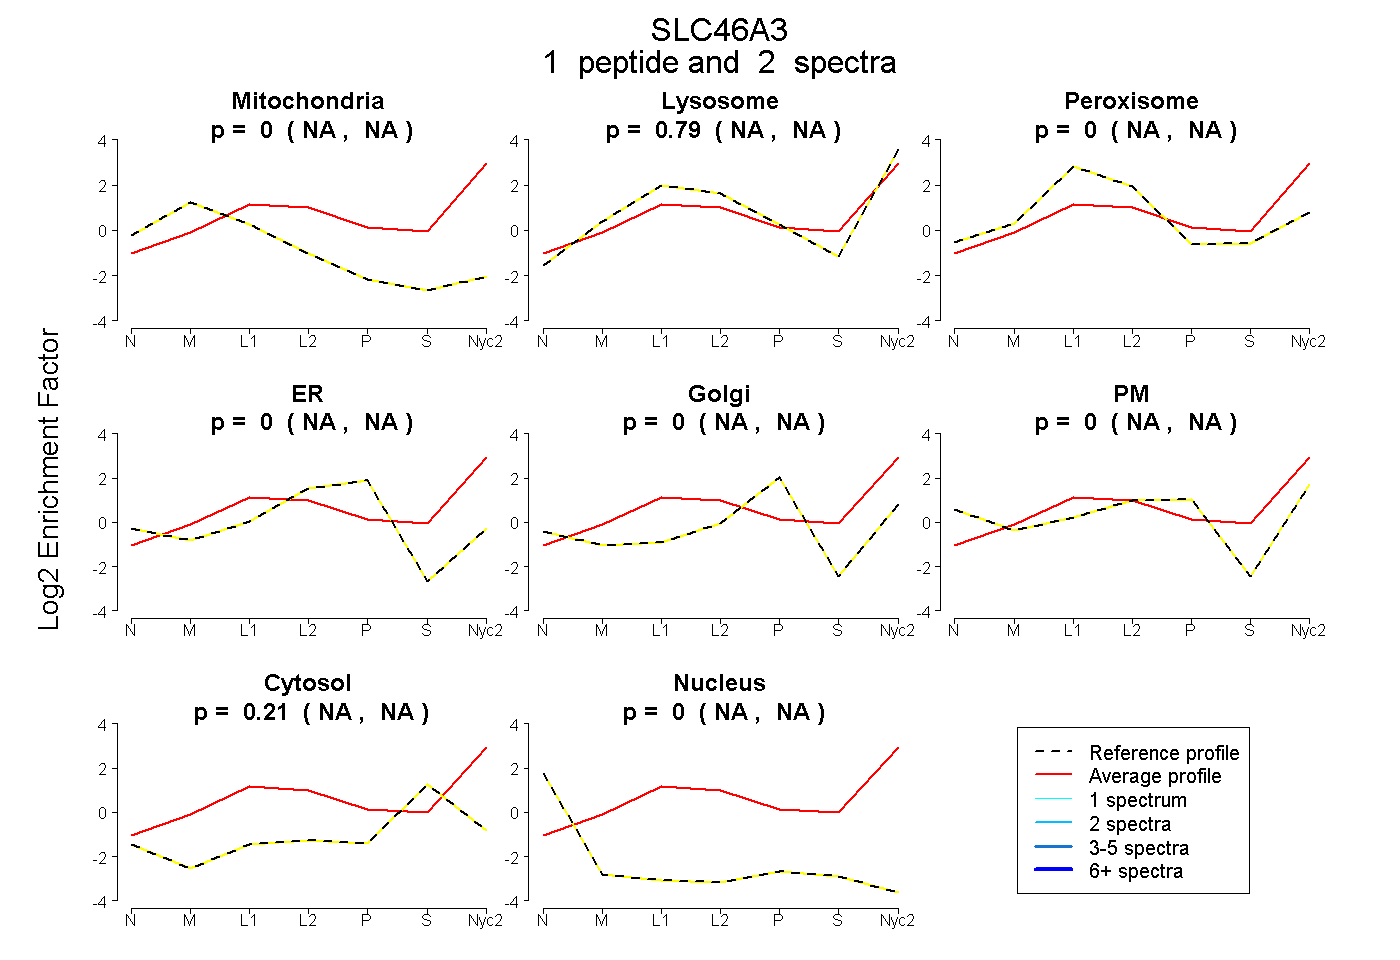
| Expt A |
1 peptide |
2 spectra |
|
0.000 NA | NA |
0.791 NA | NA |
0.000 NA | NA |
0.000 NA | NA |
0.000 NA | NA |
0.000 NA | NA |
0.209 NA | NA |
0.000 NA | NA |
||
| Plot | Lyso | Other | |||||||||||
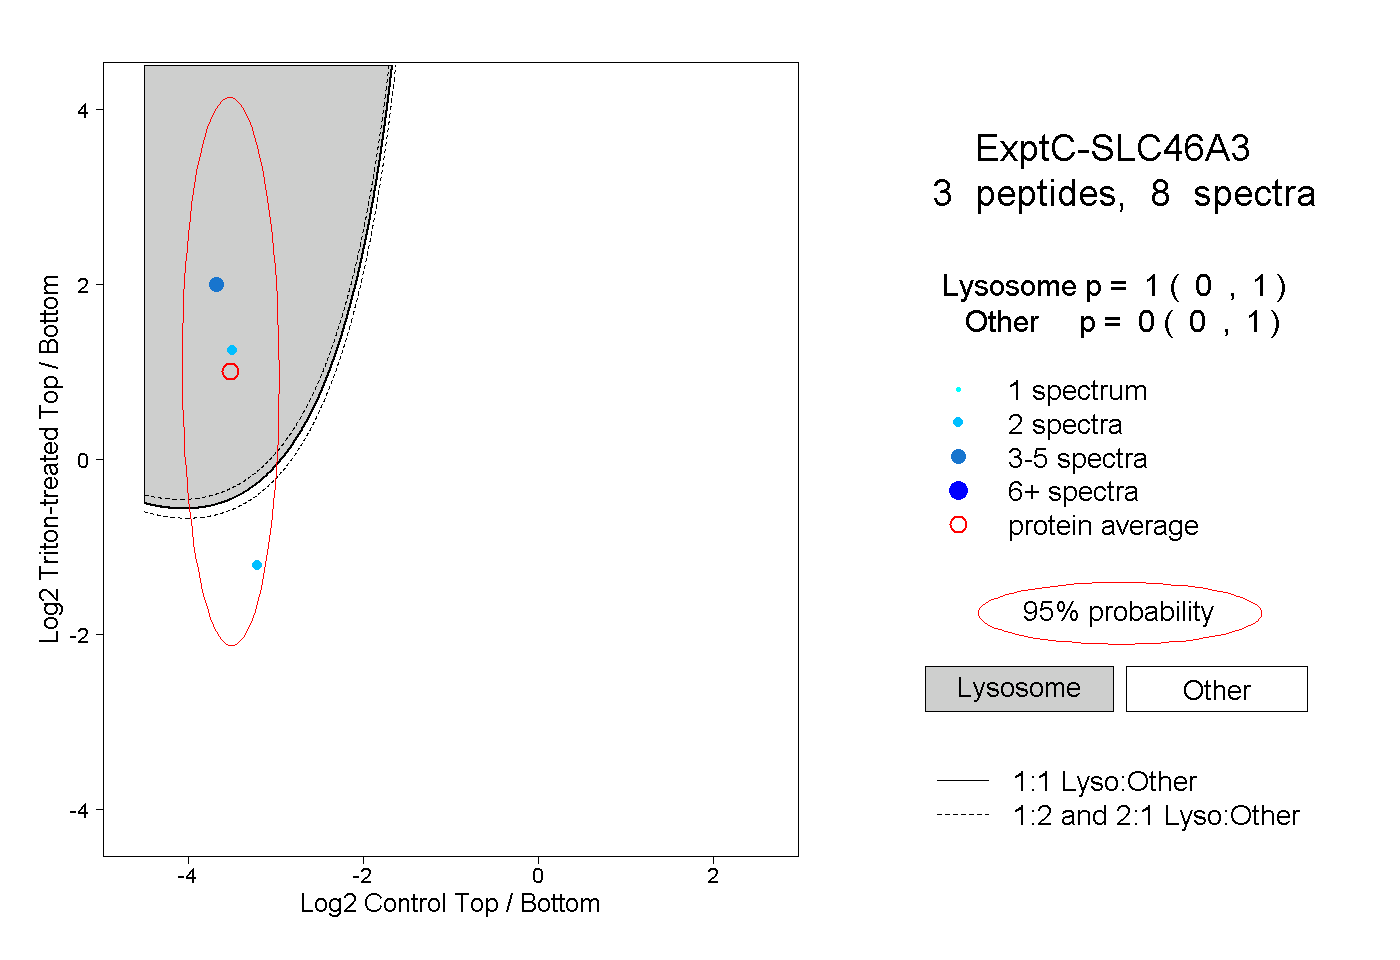
| Expt C |
3 peptides |
8 spectra |
|
1.000 0.000 | 1.000 |
0.000 0.000 | 1.000 |
||||||||
| Plot | Lyso | Other | |||||||||||
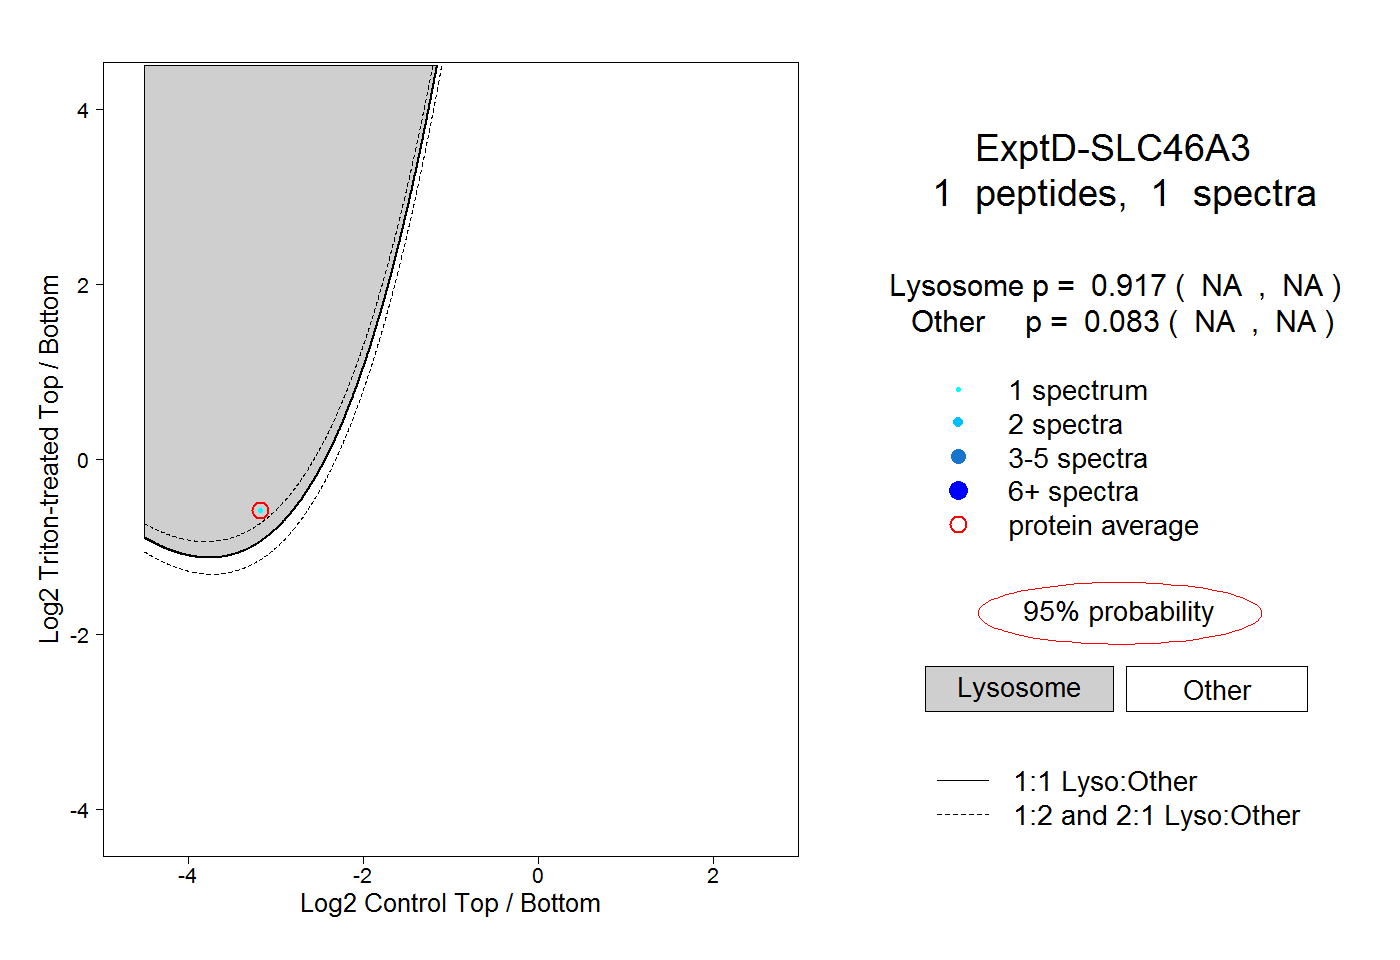
| Expt D |
1 peptide |
1 spectrum |
|
0.917 NA | NA |
0.083 NA | NA |