 4
4peptides
spectra
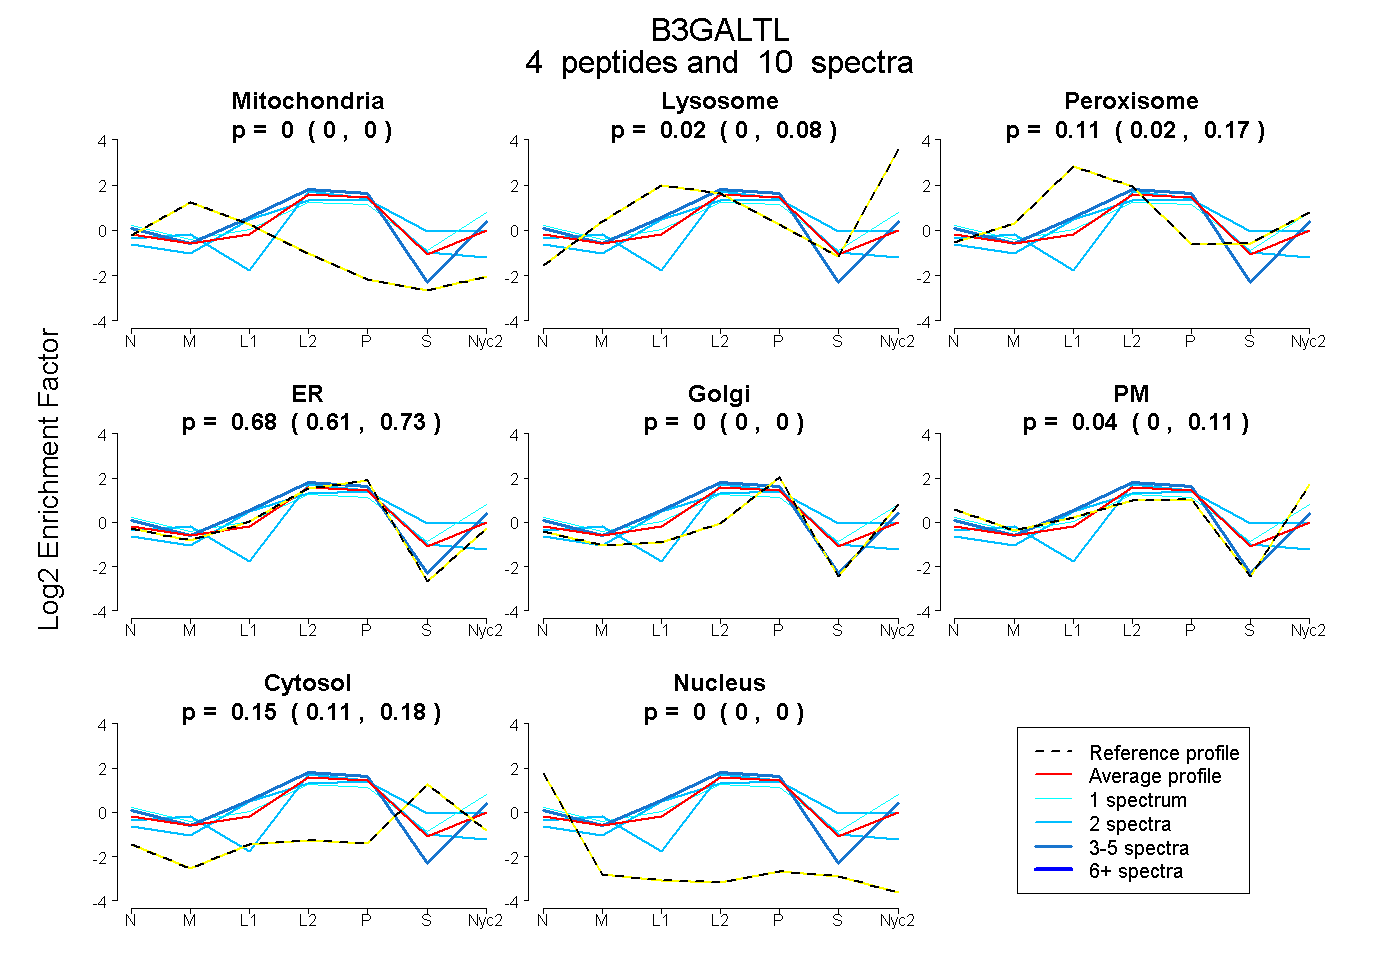
0.000 | 0.000
0.000 | 0.076
0.016 | 0.175
0.607 | 0.731
0.000 | 0.000
0.000 | 0.114
0.111 | 0.179
0.000 | 0.000
1peptide
spectrum
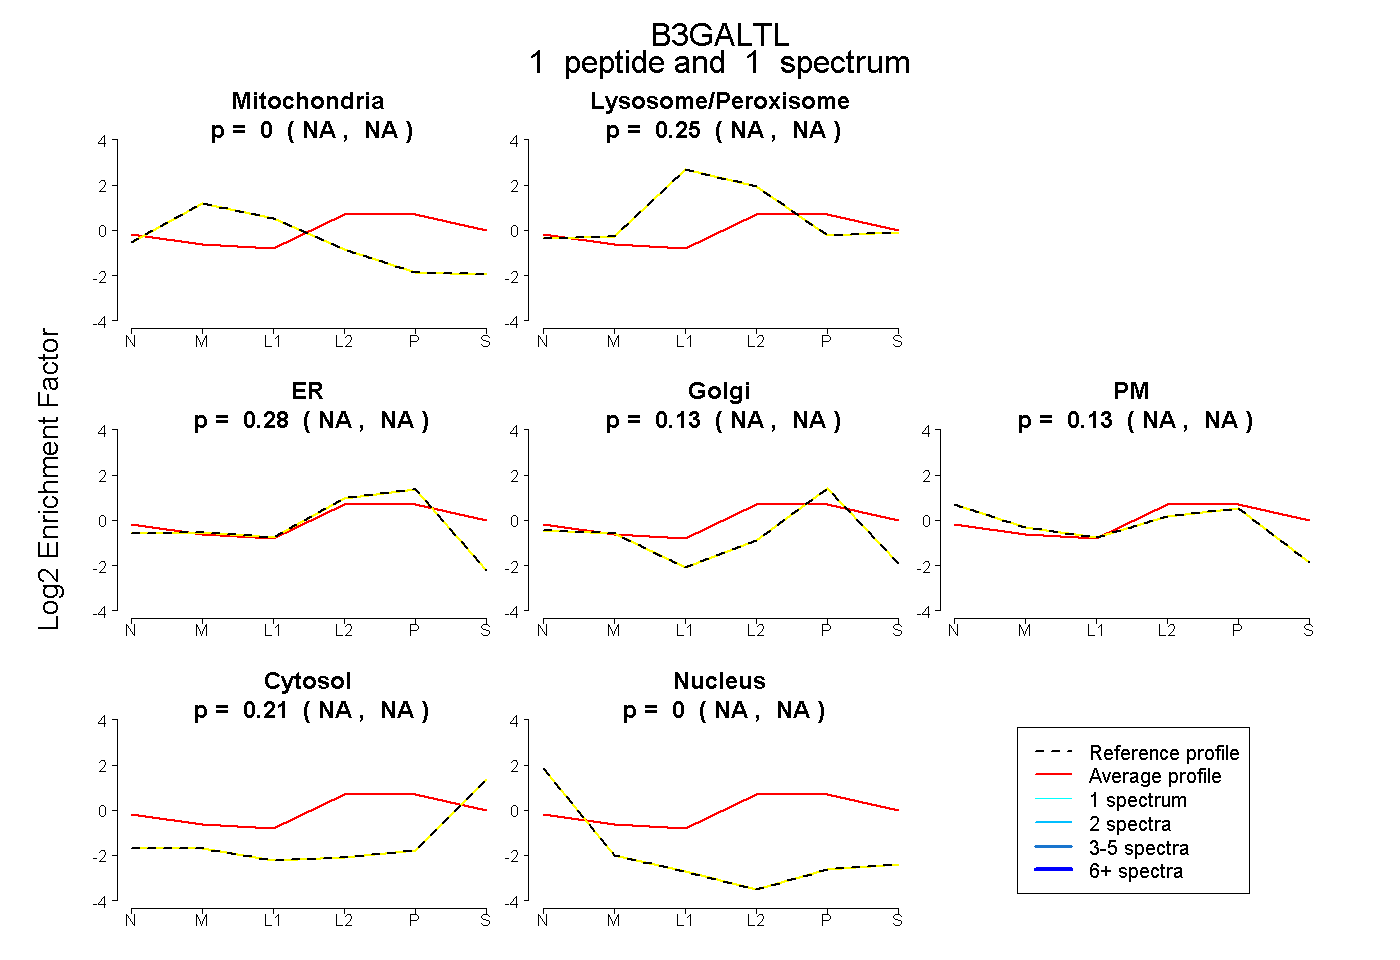
NA | NA
NA | NA
NA | NA
NA | NA
NA | NA
NA | NA
NA | NA
7peptides
spectra
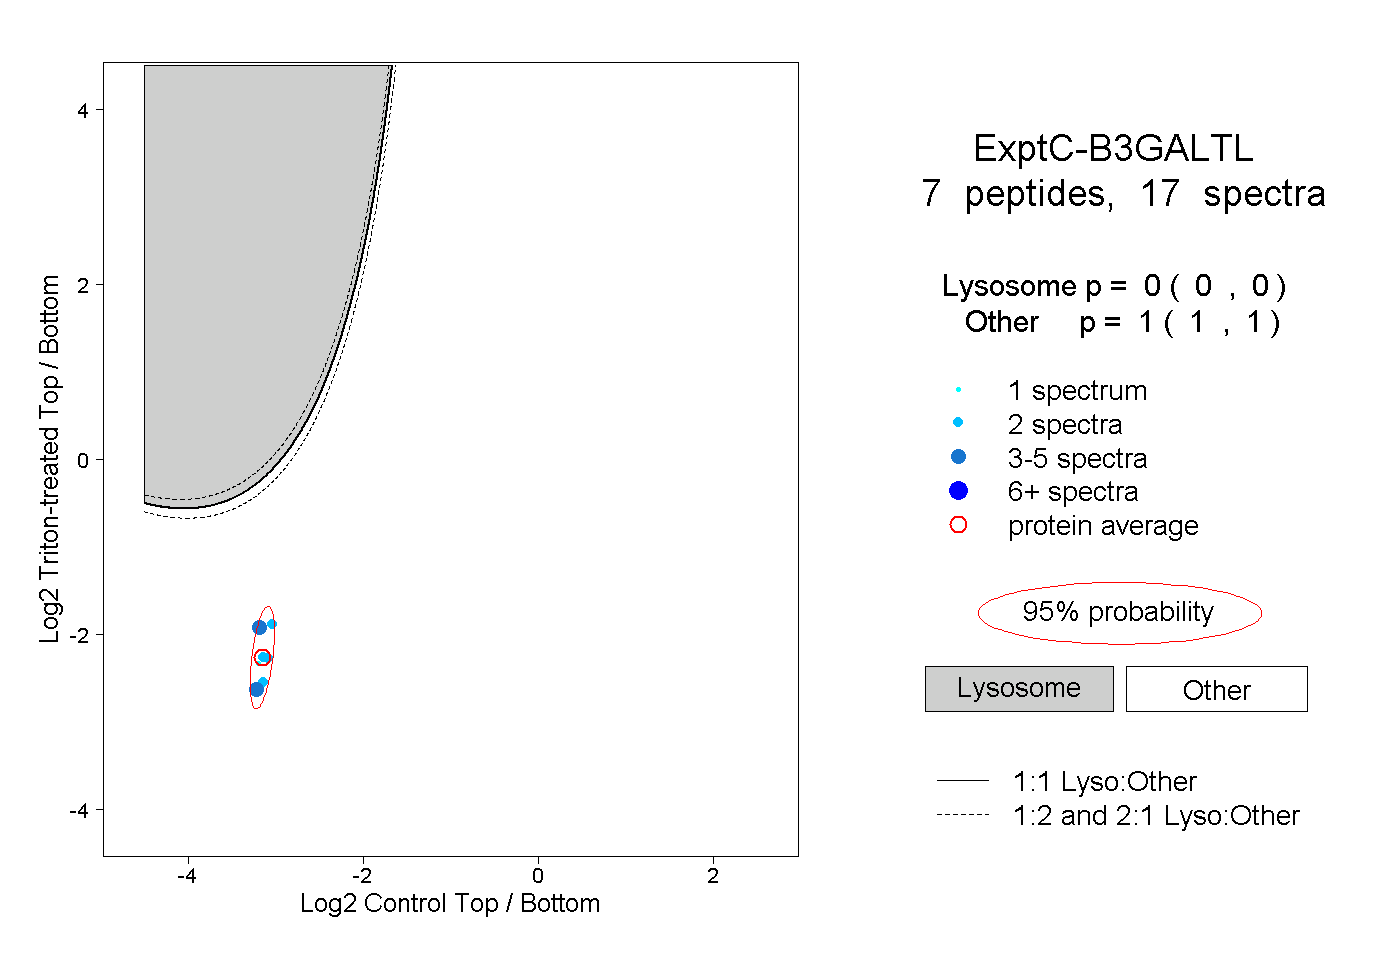
0.000 | 0.000
1.000 | 1.000
2peptides
spectra
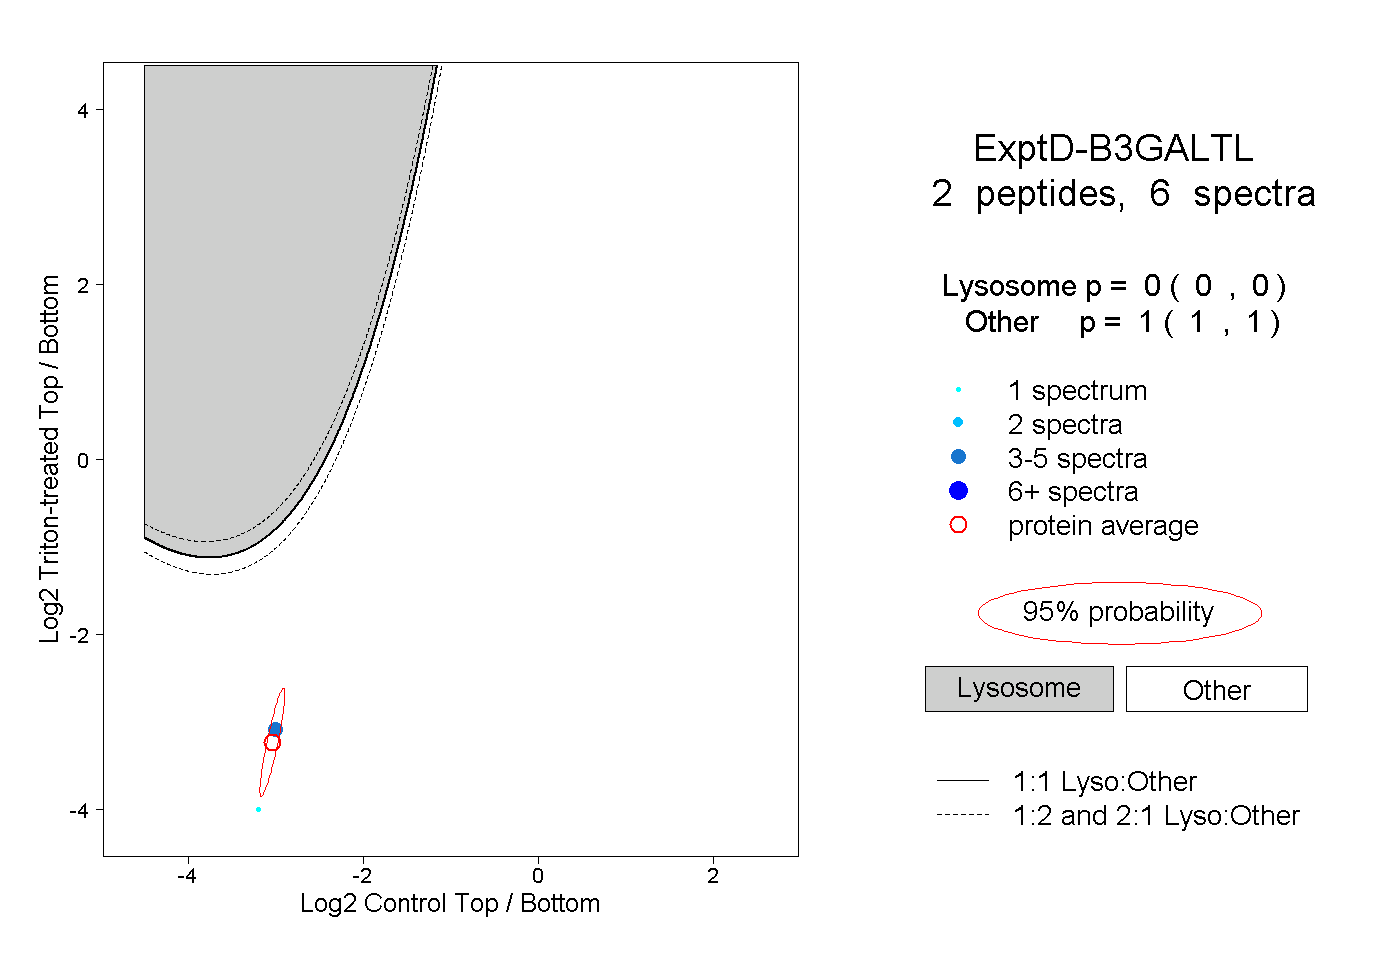
0.000 | 0.000
1.000 | 1.000