 2
2peptides
spectra
0.000 | 0.019
0.000 | 0.000
0.000 | 0.140
0.000 | 0.011
0.000 | 0.087
0.203 | 0.379
0.548 | 0.670
0.000 | 0.006
4peptides
spectra
0.000 | 0.000
1.000 | 1.000
| Plot | Mito | Lyso | Perox | ER | Golgi | PM | Cytosol | Nucleus | |||||
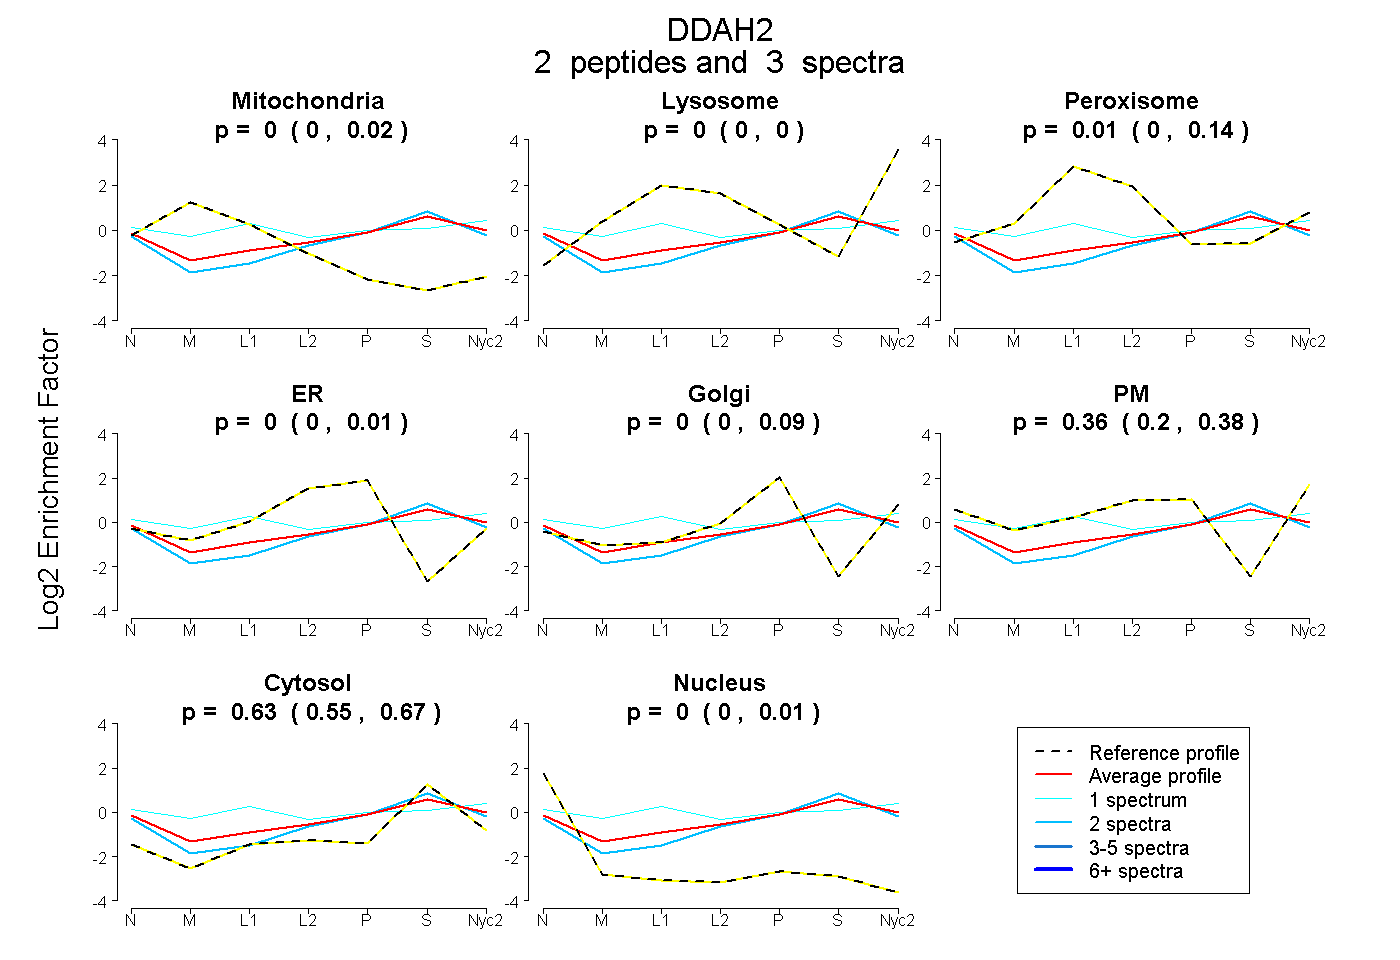
| Expt A |
2 peptides |
3 spectra |
|
0.000 0.000 | 0.019 |
0.000 0.000 | 0.000 |
0.009 0.000 | 0.140 |
0.000 0.000 | 0.011 |
0.000 0.000 | 0.087 |
0.357 0.203 | 0.379 |
0.635 0.548 | 0.670 |
0.000 0.000 | 0.006 |
||
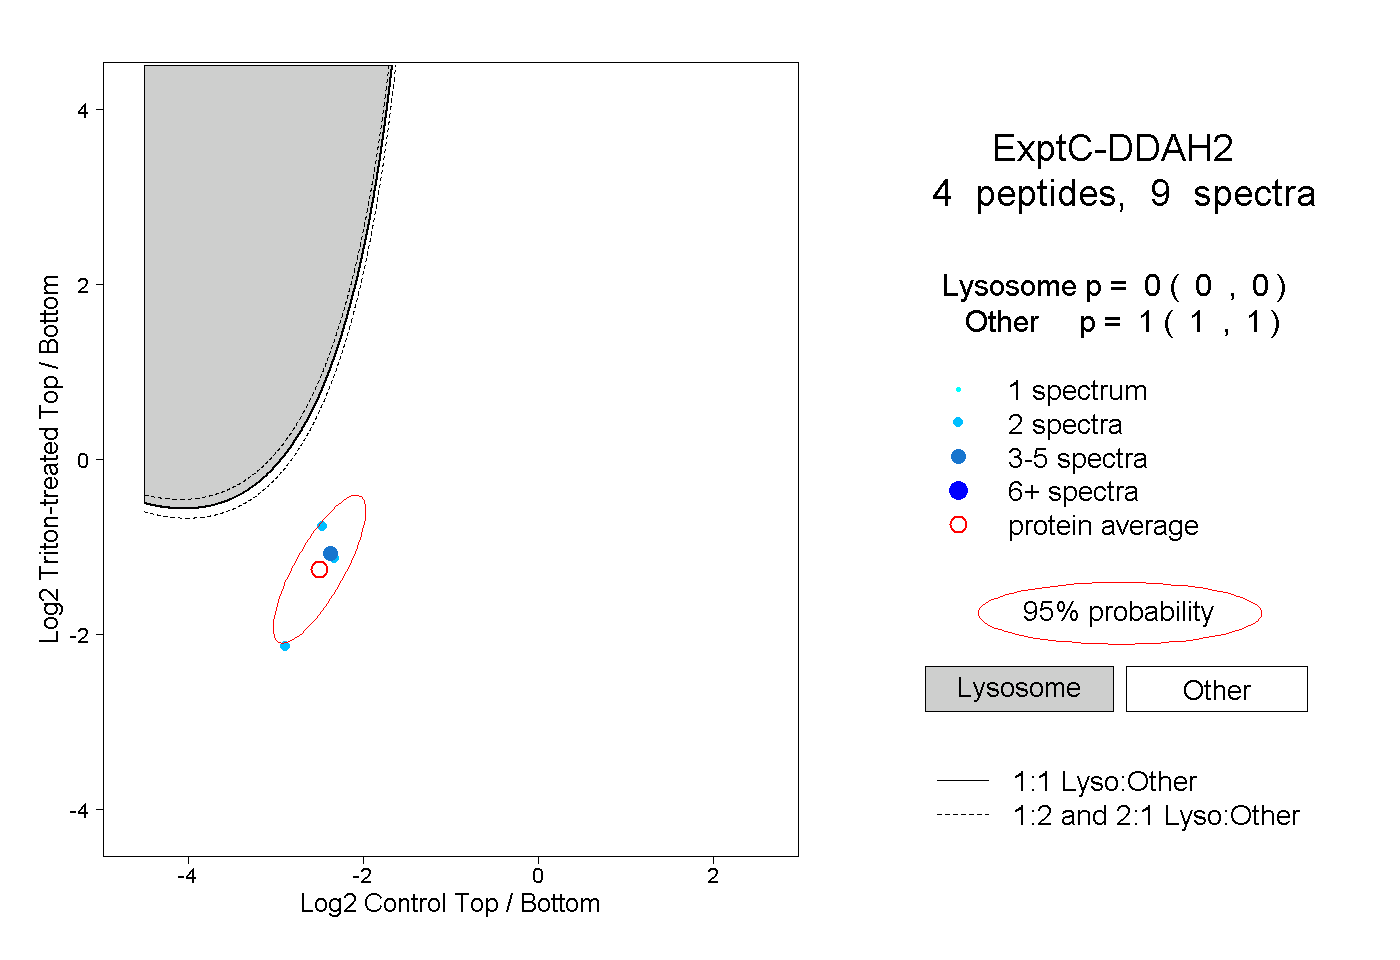
| Plot | Lyso | Other | |||||||||||
| Expt C |
4 peptides |
9 spectra |
|
0.000 0.000 | 0.000 |
1.000 1.000 | 1.000 |