 8
8peptides
spectra
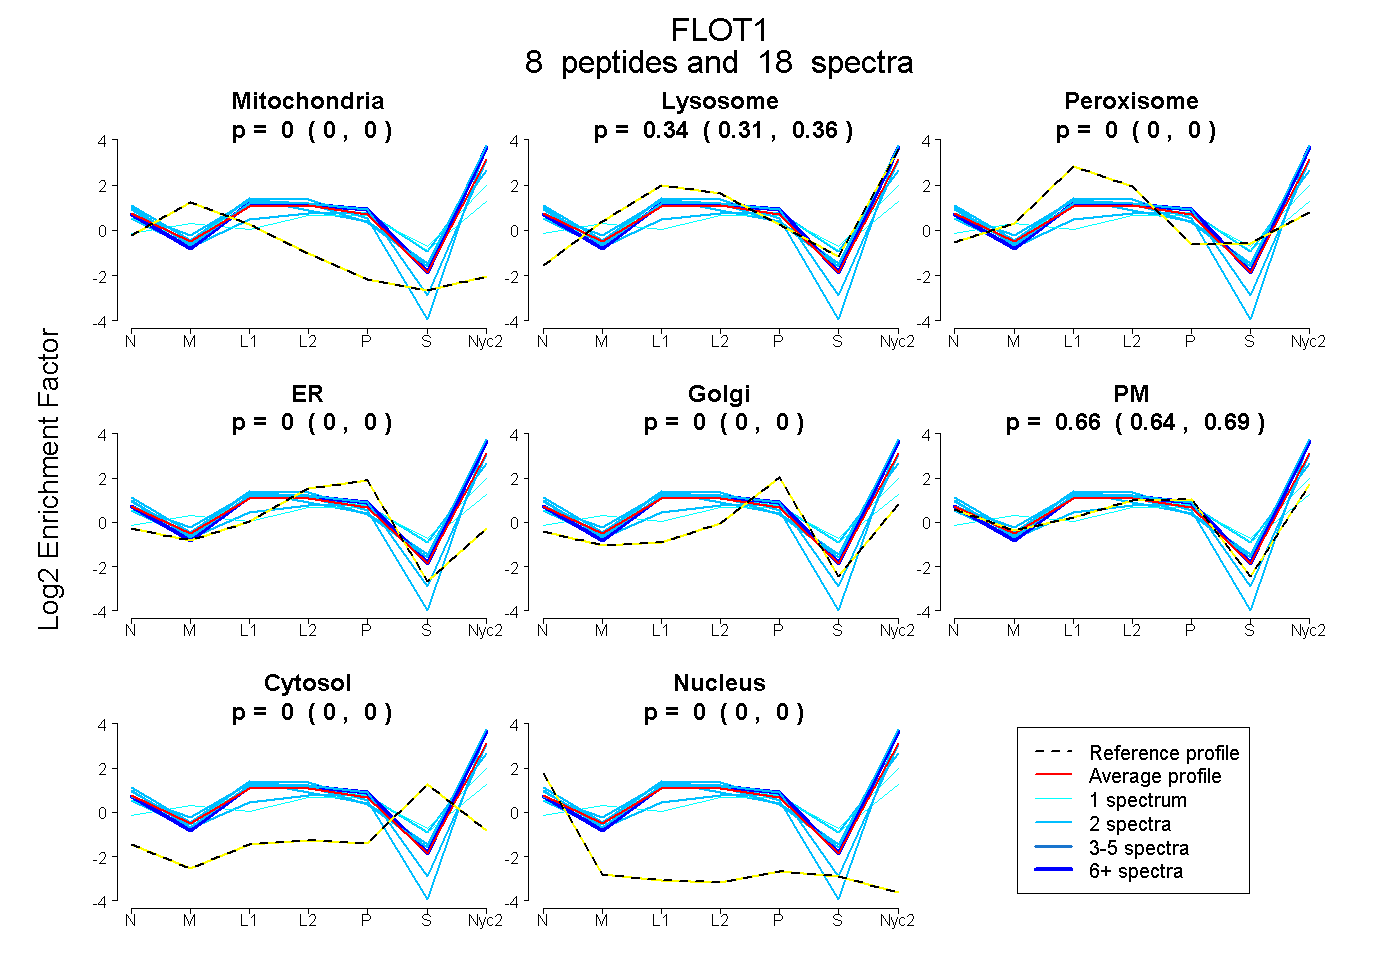
0.000 | 0.000
0.309 | 0.356
0.000 | 0.000
0.000 | 0.000
0.000 | 0.000
0.641 | 0.686
0.000 | 0.000
0.000 | 0.000
4peptides
spectra
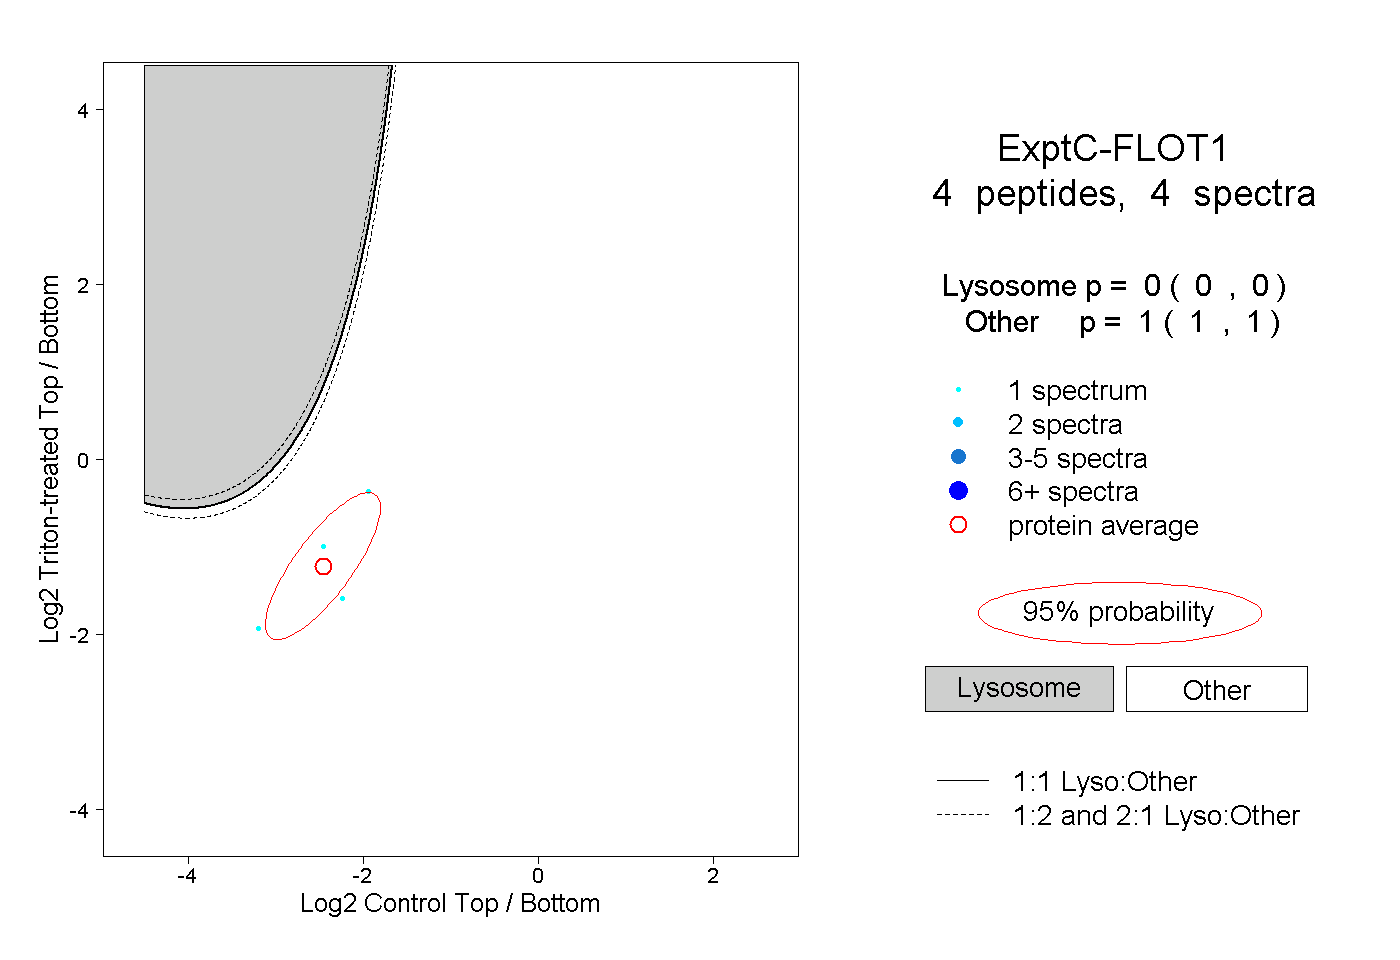
0.000 | 0.000
1.000 | 1.000
1peptide
spectrum
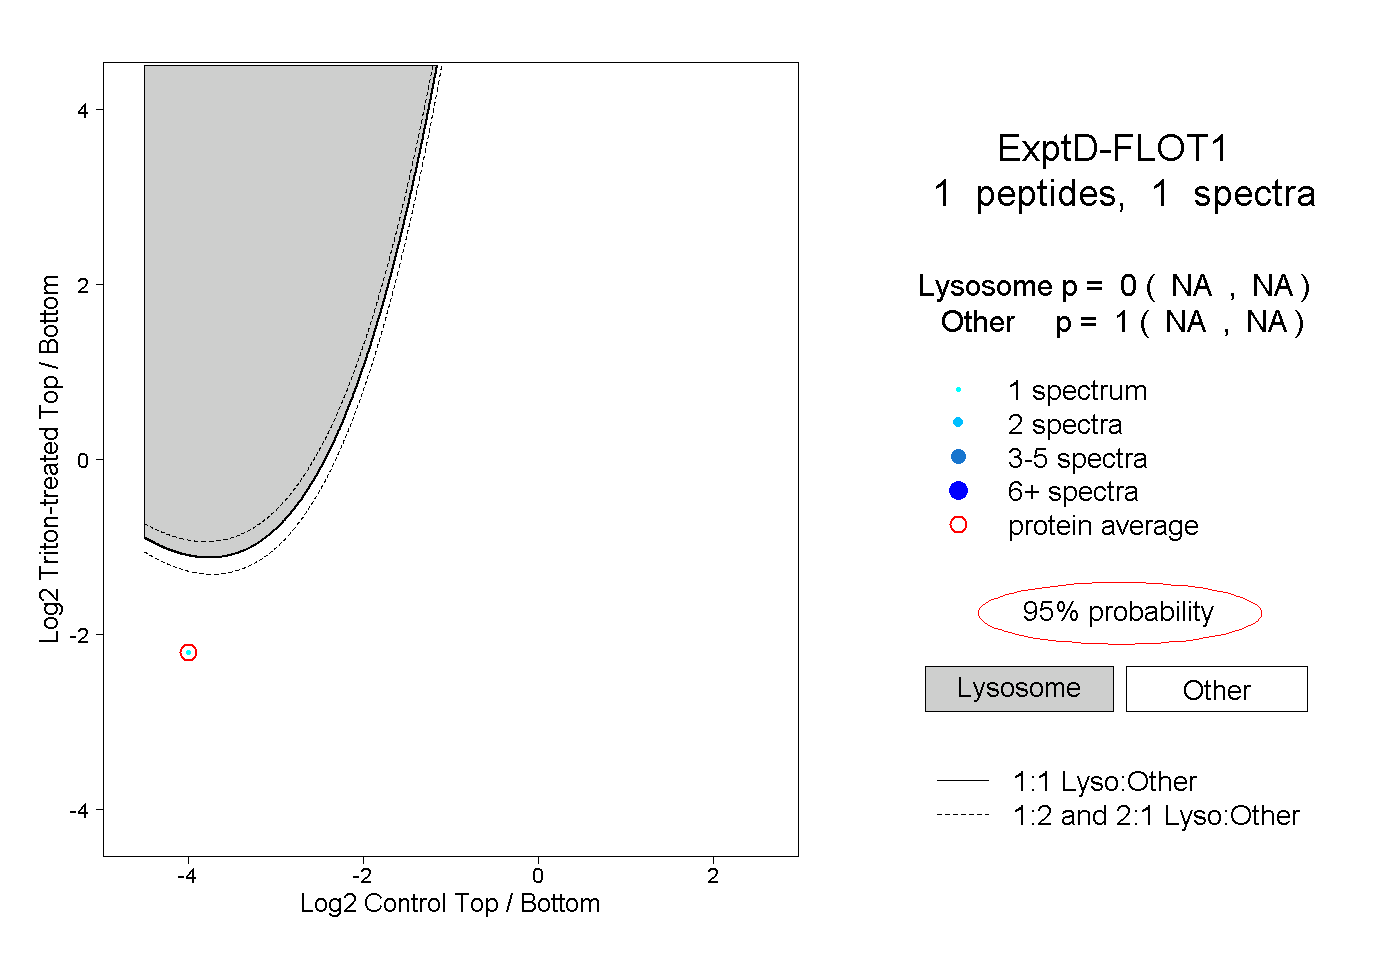
NA | NA
NA | NA