 3
3peptides
spectra
0.781 | 0.858
0.000 | 0.154
0.000 | 0.130
0.000 | 0.000
0.000 | 0.000
0.000 | 0.002
0.000 | 0.032
0.000 | 0.034
| Plot | Mito | Lyso | Perox | ER | Golgi | PM | Cytosol | Nucleus | |||||
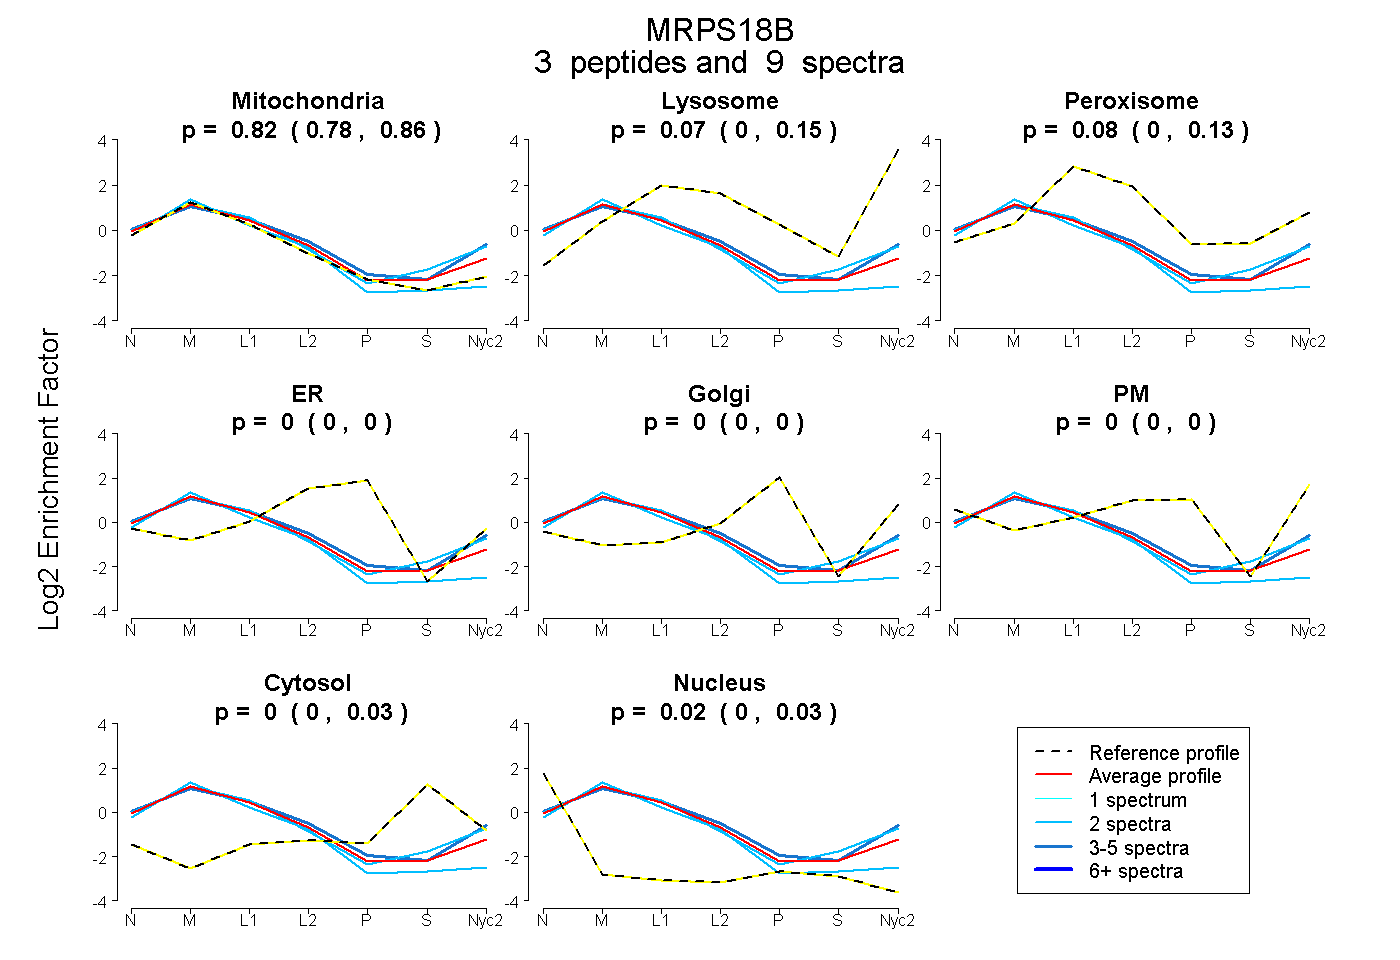
| Expt A |
3 peptides |
9 spectra |
|
0.821 0.781 | 0.858 |
0.069 0.000 | 0.154 |
0.084 0.000 | 0.130 |
0.000 0.000 | 0.000 |
0.000 0.000 | 0.000 |
0.000 0.000 | 0.002 |
0.003 0.000 | 0.032 |
0.024 0.000 | 0.034 |
| 5 spectra, LHVDFR | 0.717 | 0.187 | 0.038 | 0.000 | 0.000 | 0.017 | 0.000 | 0.041 | ||
| 2 spectra, YLDSEEYQNR | 0.772 | 0.121 | 0.050 | 0.000 | 0.000 | 0.000 | 0.057 | 0.000 | ||
| 2 spectra, VAGNPCPICR | 0.996 | 0.000 | 0.000 | 0.000 | 0.000 | 0.000 | 0.000 | 0.004 |
| Plot | Mito | Lyso or Perox | ER | Golgi | PM | Cytosol | Nucleus | ||||||
| Expt B |
1 peptide |
1 spectrum |
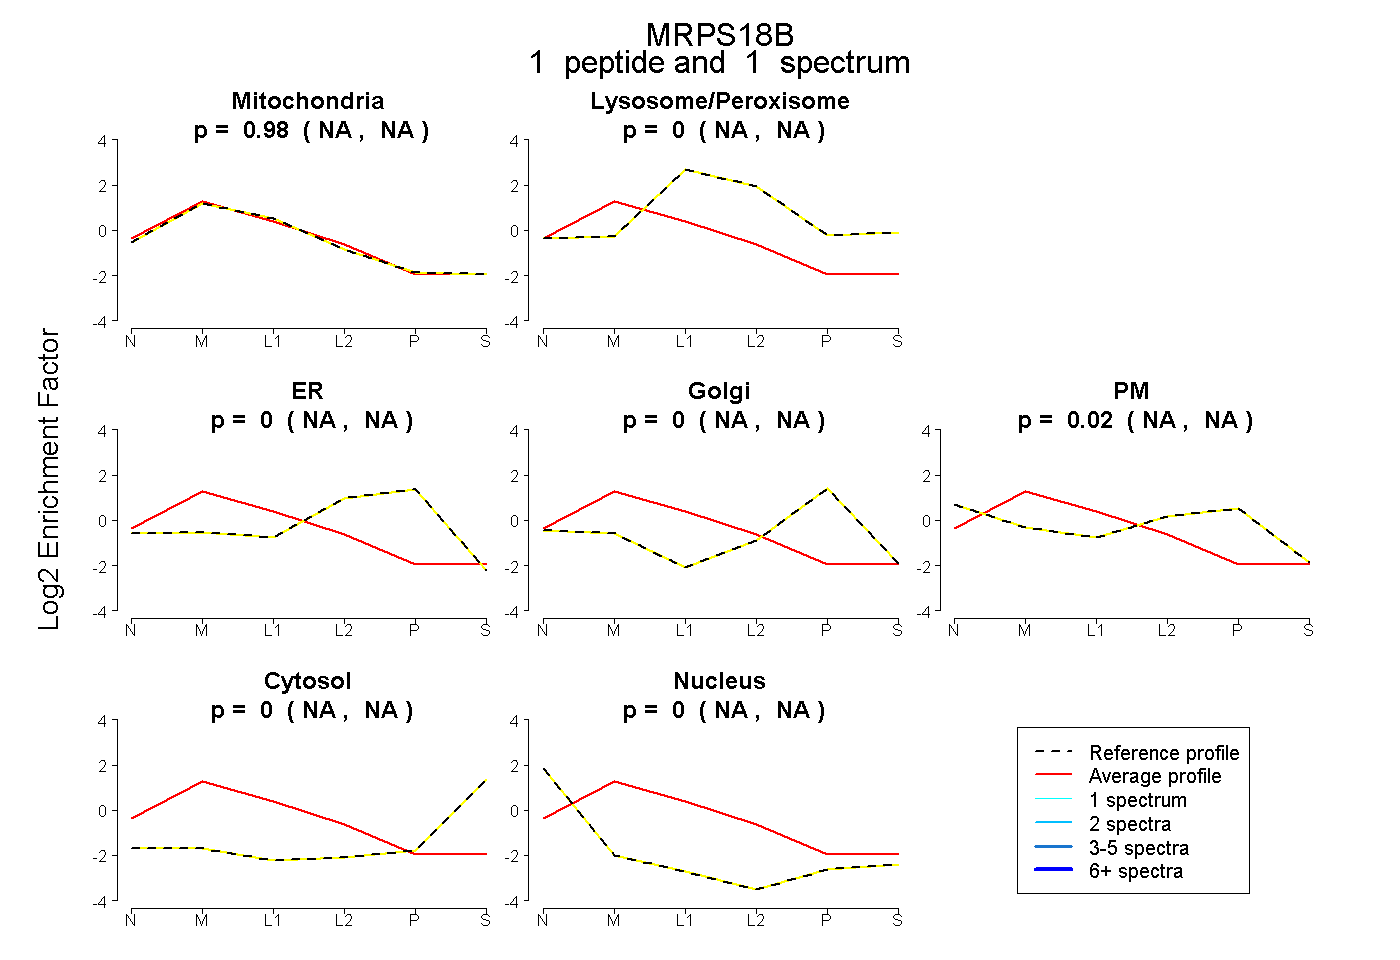 |
0.976 NA | NA |
0.000 NA | NA |
0.000 NA | NA |
0.000 NA | NA |
0.024 NA | NA |
0.000 NA | NA |
0.000 NA | NA |
|||
| Plot | Lyso | Other | |||||||||||
| Expt C |
4 peptides |
20 spectra |
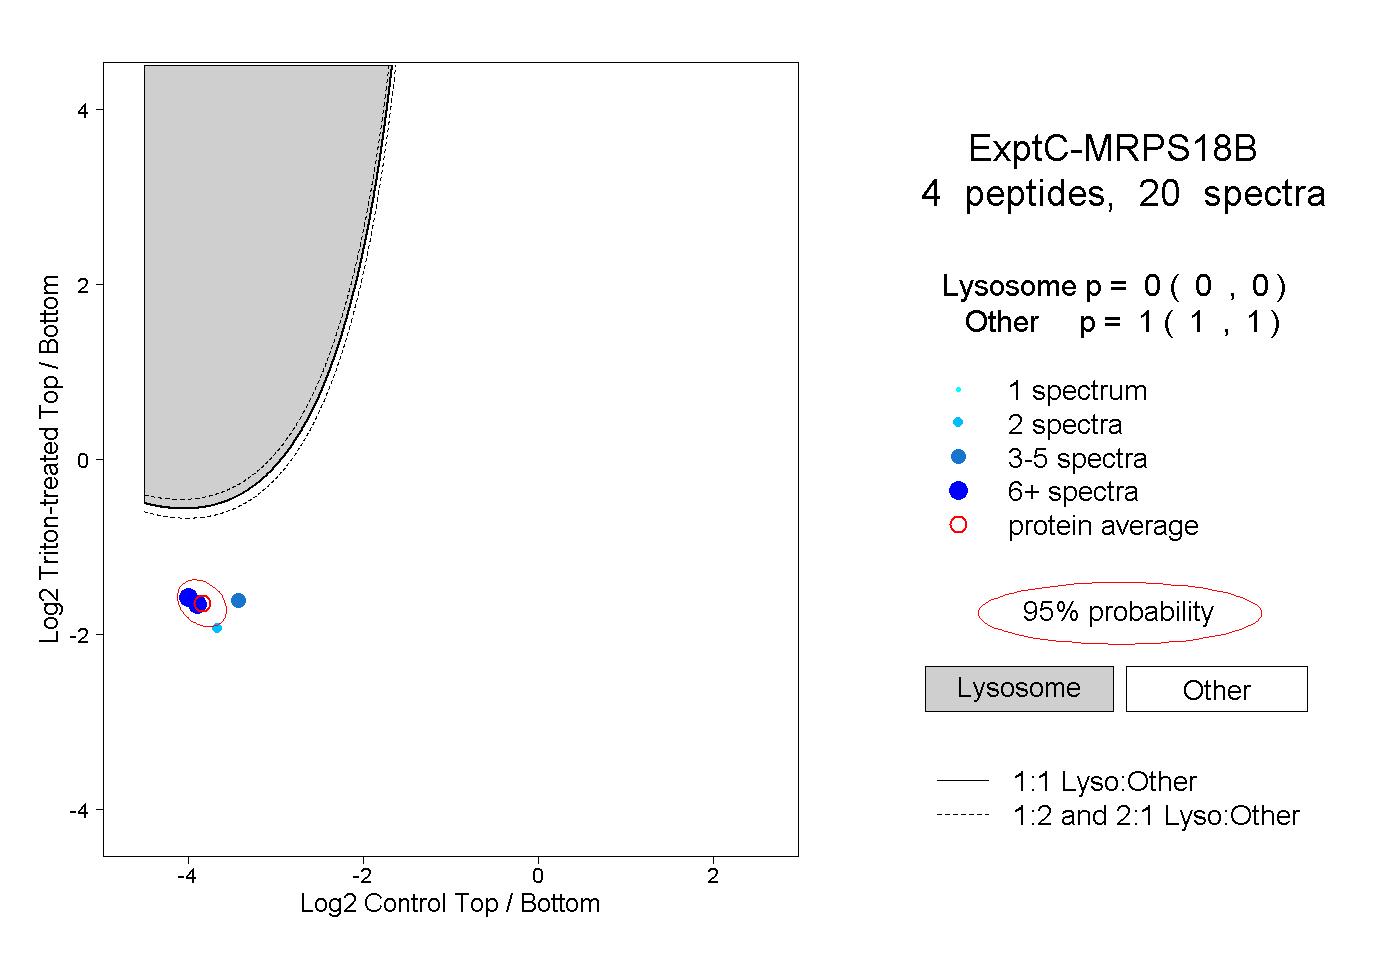 |
0.000 0.000 | 0.000 |
1.000 1.000 | 1.000 |
||||||||
| Plot | Lyso | Other | |||||||||||
| Expt D |
2 peptides |
4 spectra |
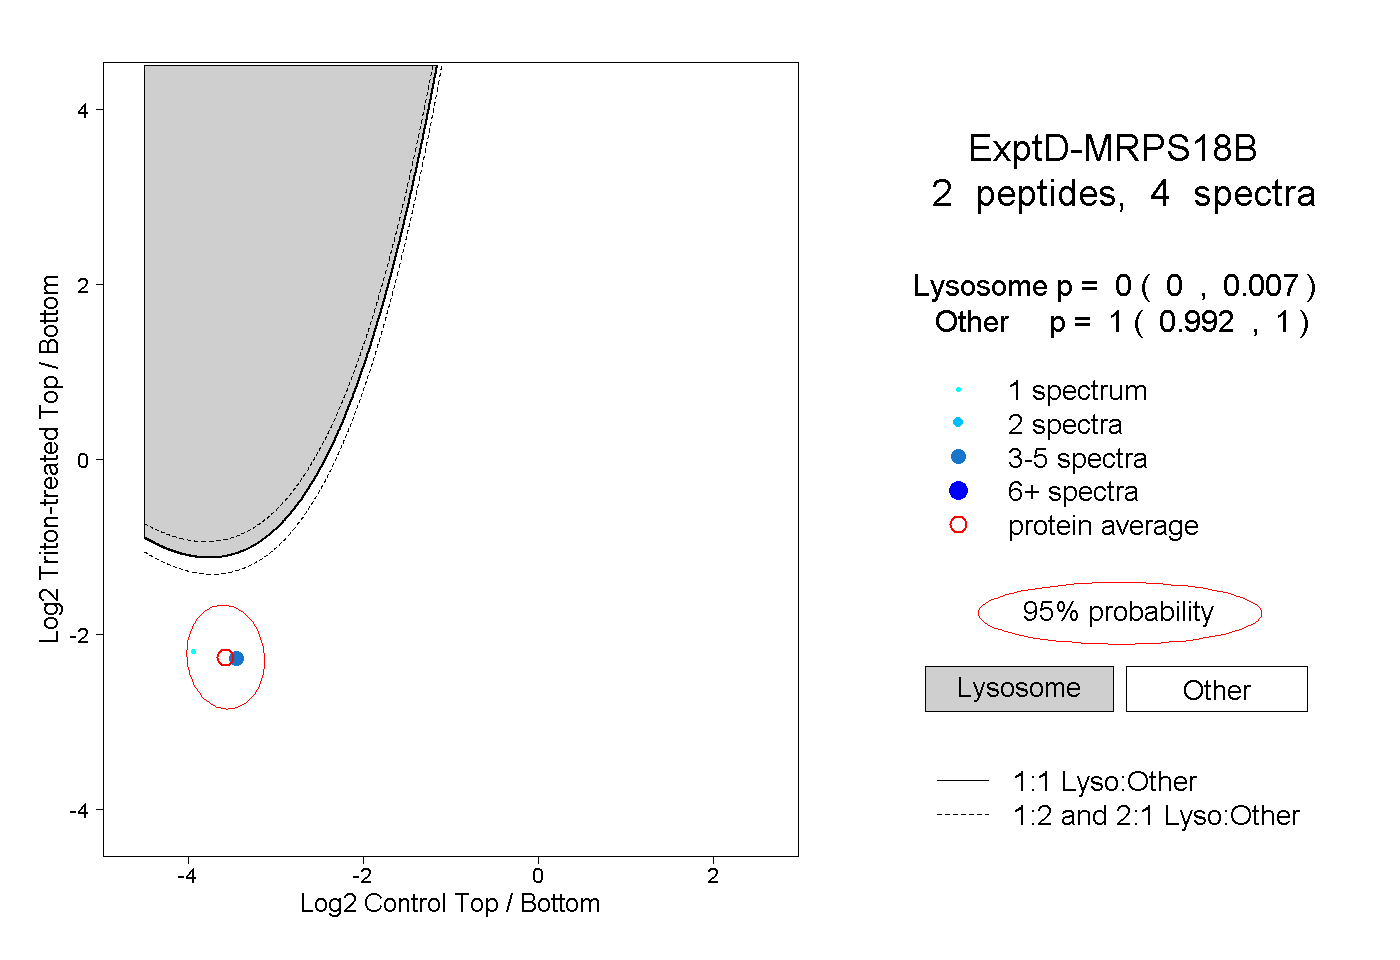 |
0.000 0.000 | 0.007 |
1.000 0.992 | 1.000 |