 6
6peptides
spectra
0.000 | 0.000
0.146 | 0.173
0.000 | 0.000
0.000 | 0.000
0.000 | 0.000
0.257 | 0.281
0.560 | 0.577
0.000 | 0.000
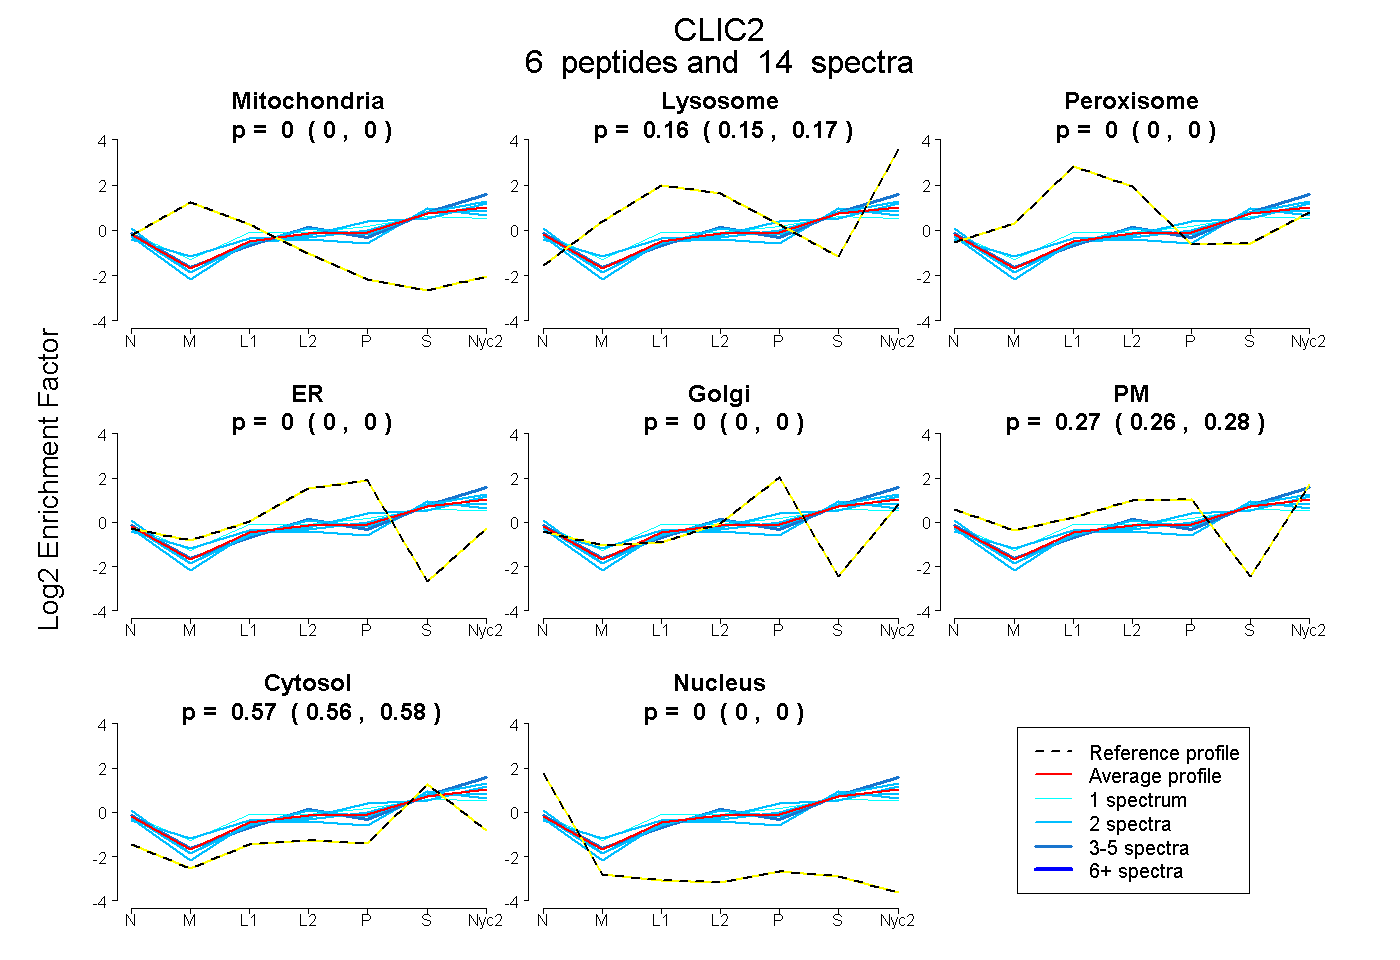
| Plot | Mito | Lyso | Perox | ER | Golgi | PM | Cytosol | Nucleus | |||||
| Expt A |
6 peptides |
14 spectra |
|
0.000 0.000 | 0.000 |
0.161 0.146 | 0.173 |
0.000 0.000 | 0.000 |
0.000 0.000 | 0.000 |
0.000 0.000 | 0.000 |
0.270 0.257 | 0.281 |
0.569 0.560 | 0.577 |
0.000 0.000 | 0.000 |
| 5 spectra, IEEFLEK | 0.000 | 0.233 | 0.000 | 0.000 | 0.000 | 0.227 | 0.540 | 0.000 | ||
| 2 spectra, DFDIPAEFSGVWR | 0.000 | 0.120 | 0.020 | 0.000 | 0.000 | 0.179 | 0.682 | 0.000 | ||
| 1 spectrum, EEFAHTCPEDK | 0.000 | 0.032 | 0.148 | 0.000 | 0.000 | 0.315 | 0.505 | 0.000 | ||
| 2 spectra, TLAPPR | 0.000 | 0.192 | 0.000 | 0.000 | 0.000 | 0.241 | 0.567 | 0.000 | ||
| 2 spectra, YLHNAYAR | 0.000 | 0.201 | 0.000 | 0.000 | 0.000 | 0.234 | 0.564 | 0.000 | ||
| 2 spectra, FNVTTIDTAR | 0.000 | 0.074 | 0.000 | 0.000 | 0.000 | 0.407 | 0.519 | 0.000 |
| Plot | Lyso | Other | |||||||||||
| Expt C |
6 peptides |
10 spectra |
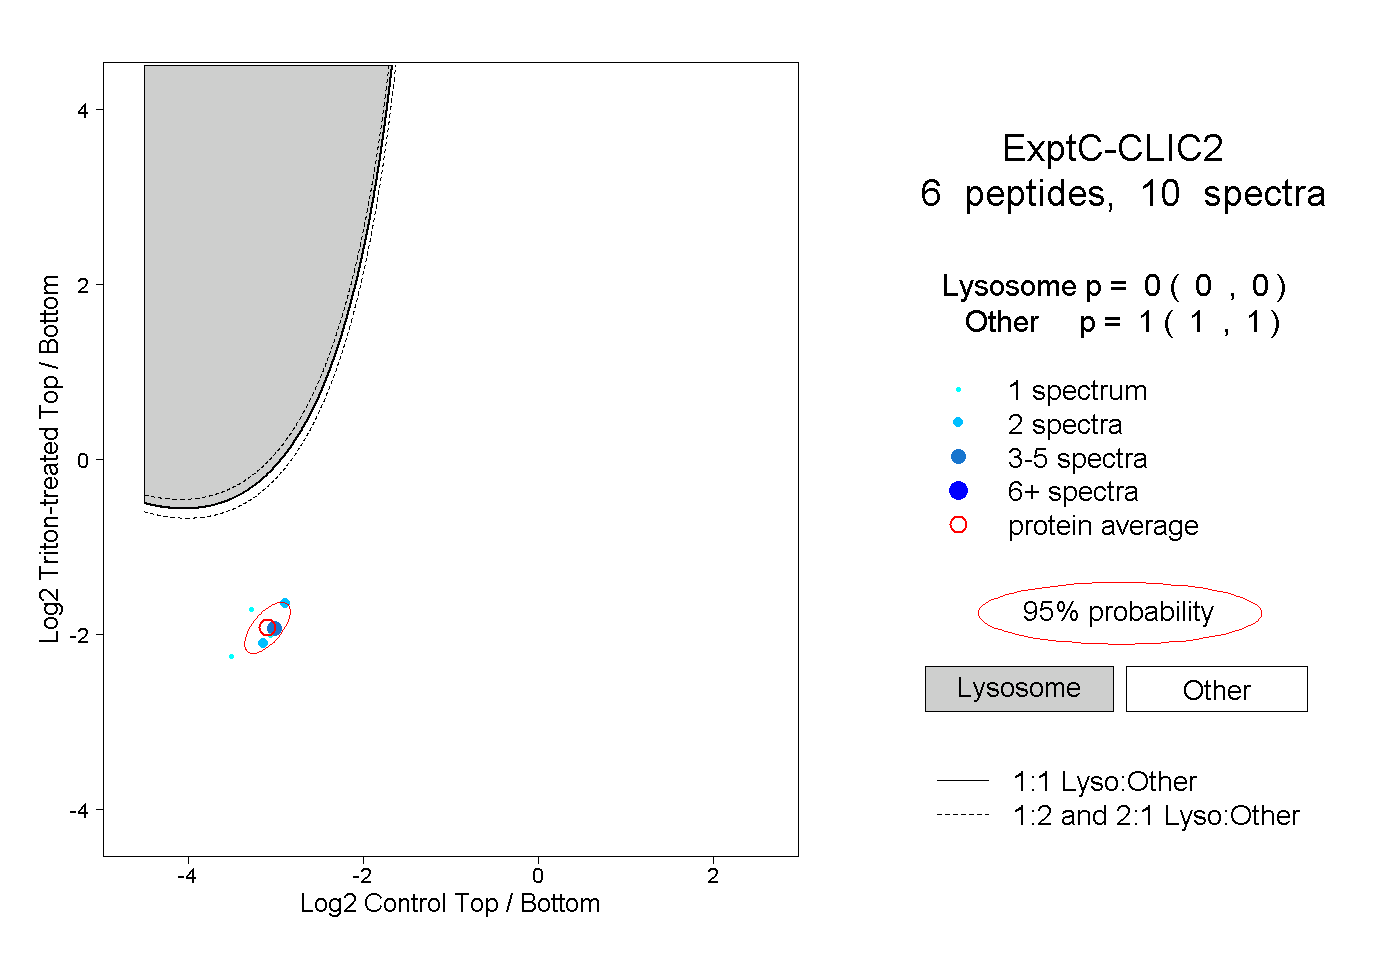 |
0.000 0.000 | 0.000 |
1.000 1.000 | 1.000 |
||||||||
| Plot | Lyso | Other | |||||||||||
| Expt D |
1 peptide |
1 spectrum |
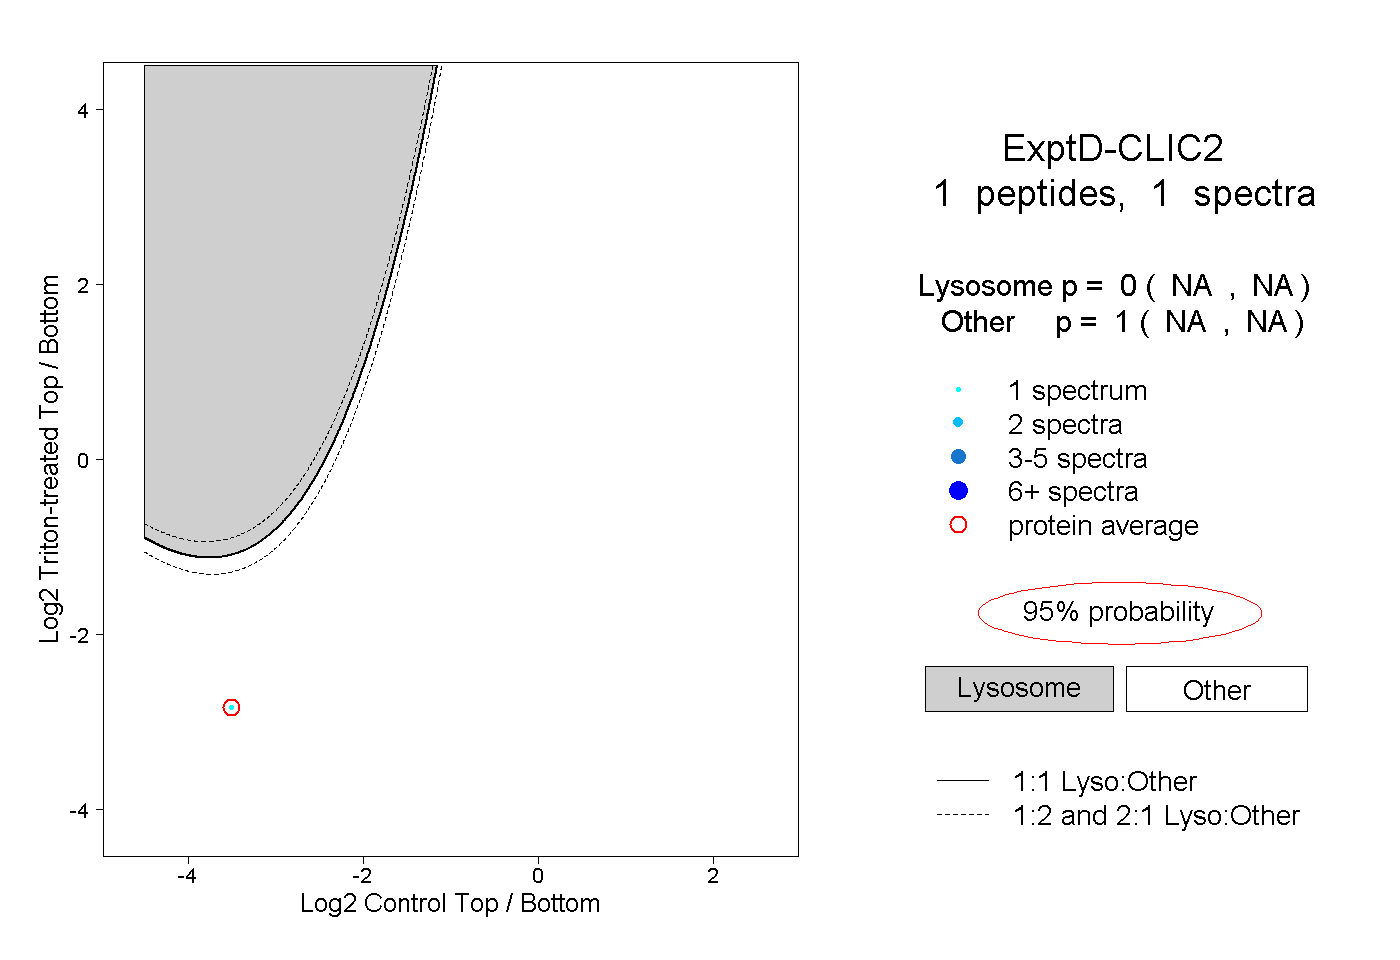 |
0.000 NA | NA |
1.000 NA | NA |