 3
3peptides
spectra
0.000 | 0.000
0.000 | 0.374
0.000 | 0.291
0.000 | 0.112
0.099 | 0.404
0.000 | 0.234
0.259 | 0.378
0.000 | 0.000
2peptides
spectra
0.000 | 0.000
1.000 | 1.000
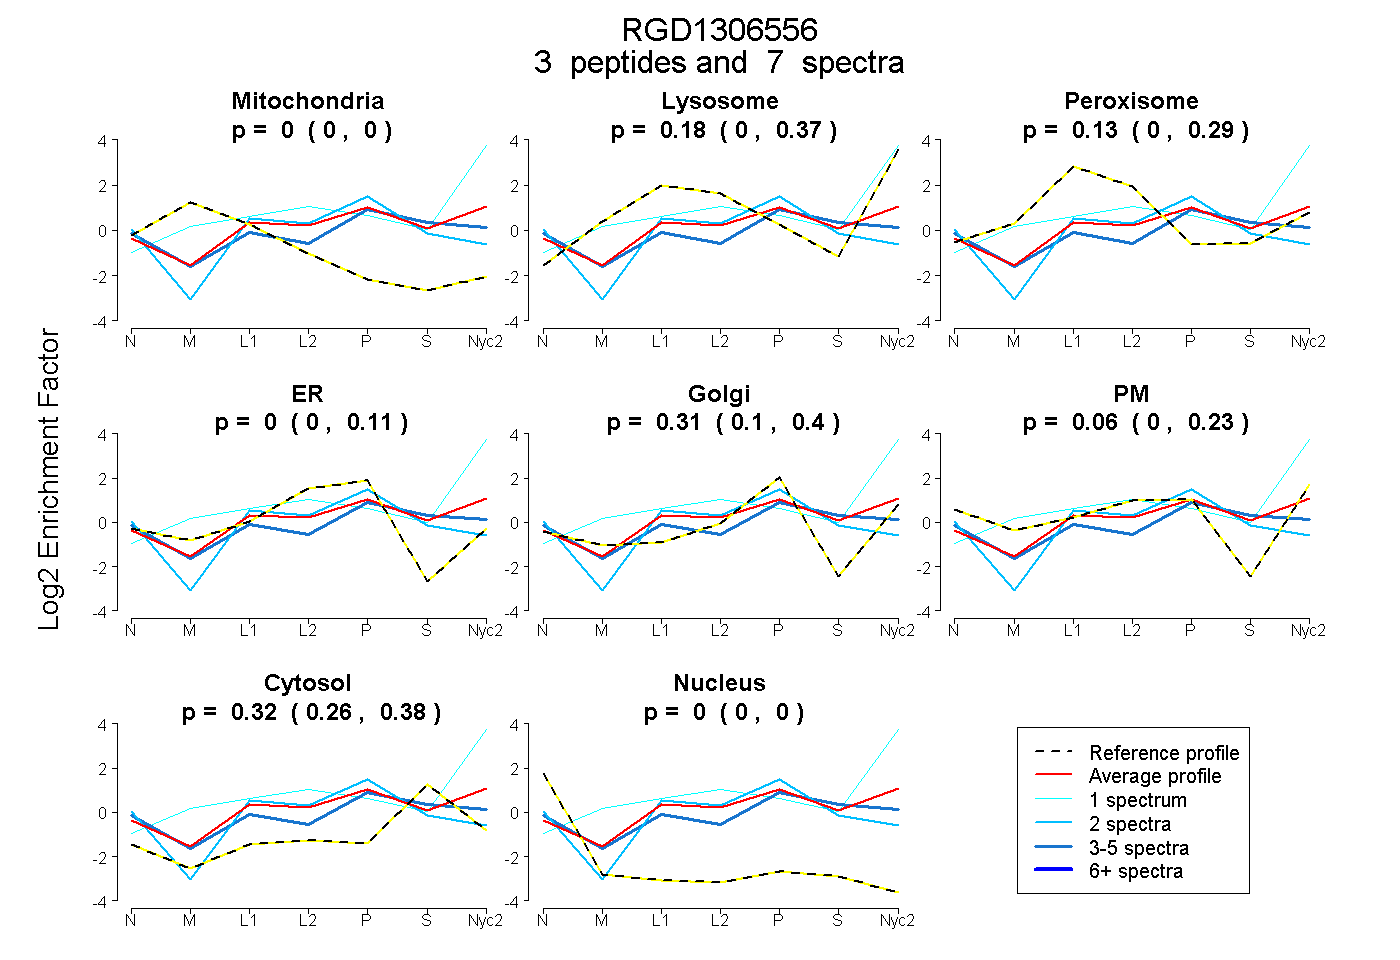
| Plot | Mito | Lyso | Perox | ER | Golgi | PM | Cytosol | Nucleus | |||||
| Expt A |
3 peptides |
7 spectra |
|
0.000 0.000 | 0.000 |
0.180 0.000 | 0.374 |
0.131 0.000 | 0.291 |
0.000 0.000 | 0.112 |
0.310 0.099 | 0.404 |
0.058 0.000 | 0.234 |
0.320 0.259 | 0.378 |
0.000 0.000 | 0.000 |
||
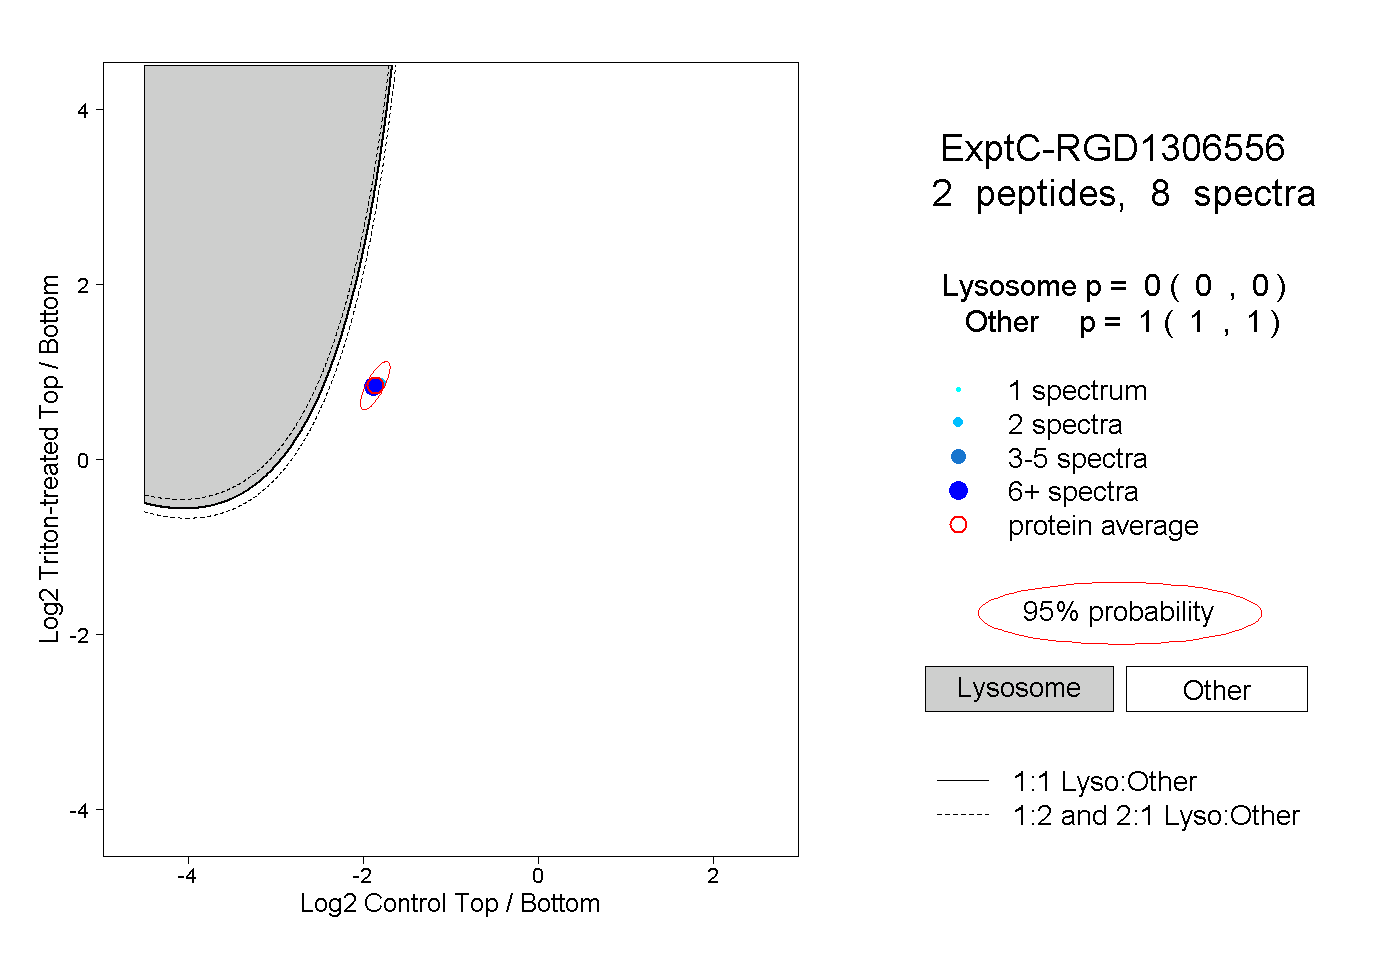
| Plot | Lyso | Other | |||||||||||
| Expt C |
2 peptides |
8 spectra |
|
0.000 0.000 | 0.000 |
1.000 1.000 | 1.000 |