 2
2peptides
spectra
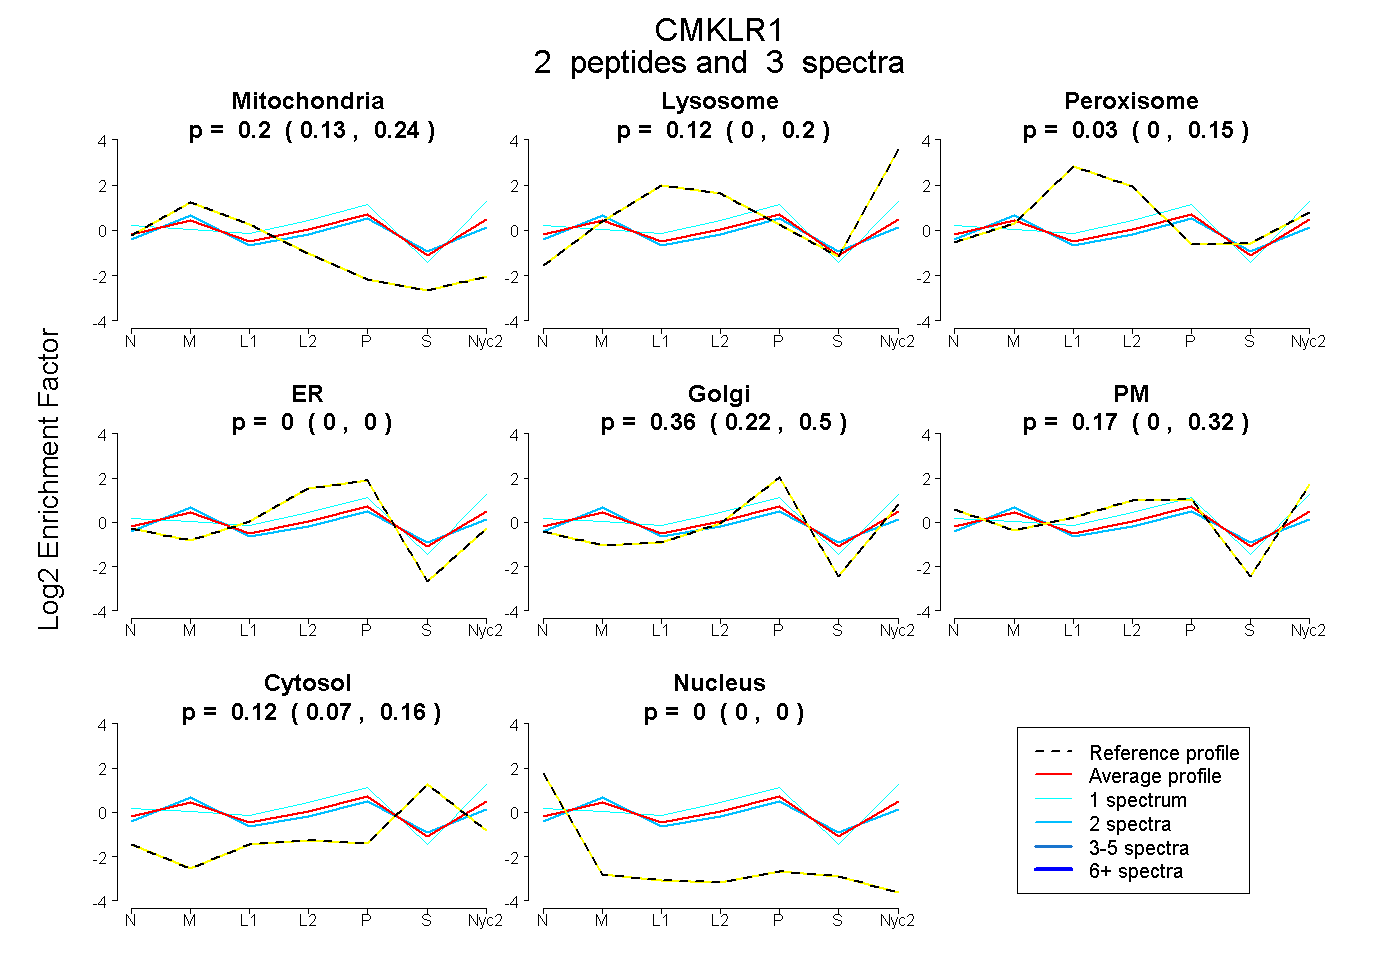
0.131 | 0.240
0.000 | 0.200
0.000 | 0.146
0.000 | 0.000
0.221 | 0.498
0.000 | 0.316
0.069 | 0.164
0.000 | 0.000
| Plot | Mito | Lyso | Perox | ER | Golgi | PM | Cytosol | Nucleus | |||||
| Expt A |
2 peptides |
3 spectra |
|
0.196 0.131 | 0.240 |
0.119 0.000 | 0.200 |
0.031 0.000 | 0.146 |
0.000 0.000 | 0.000 |
0.361 0.221 | 0.498 |
0.172 0.000 | 0.316 |
0.122 0.069 | 0.164 |
0.000 0.000 | 0.000 |
| 2 spectra, HVAVTVTR | 0.278 | 0.140 | 0.022 | 0.000 | 0.419 | 0.000 | 0.142 | 0.000 | ||
| 1 spectrum, TDPVGYSR | 0.030 | 0.074 | 0.042 | 0.000 | 0.221 | 0.546 | 0.088 | 0.000 |
| Plot | Lyso | Other | |||||||||||
| Expt C |
3 peptides |
15 spectra |
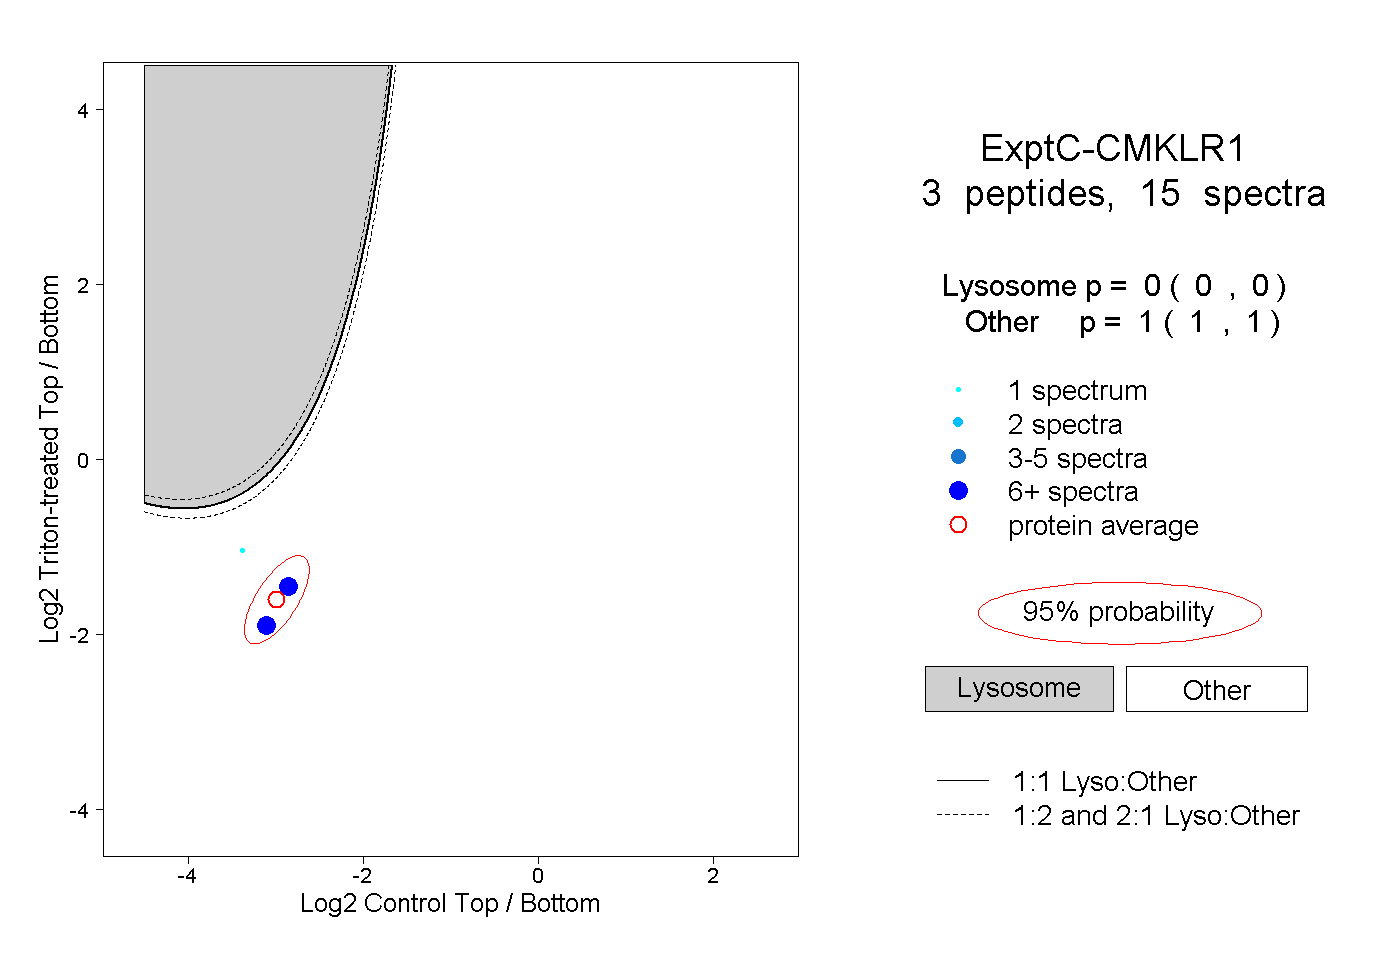 |
0.000 0.000 | 0.000 |
1.000 1.000 | 1.000 |