5
5peptides
spectra
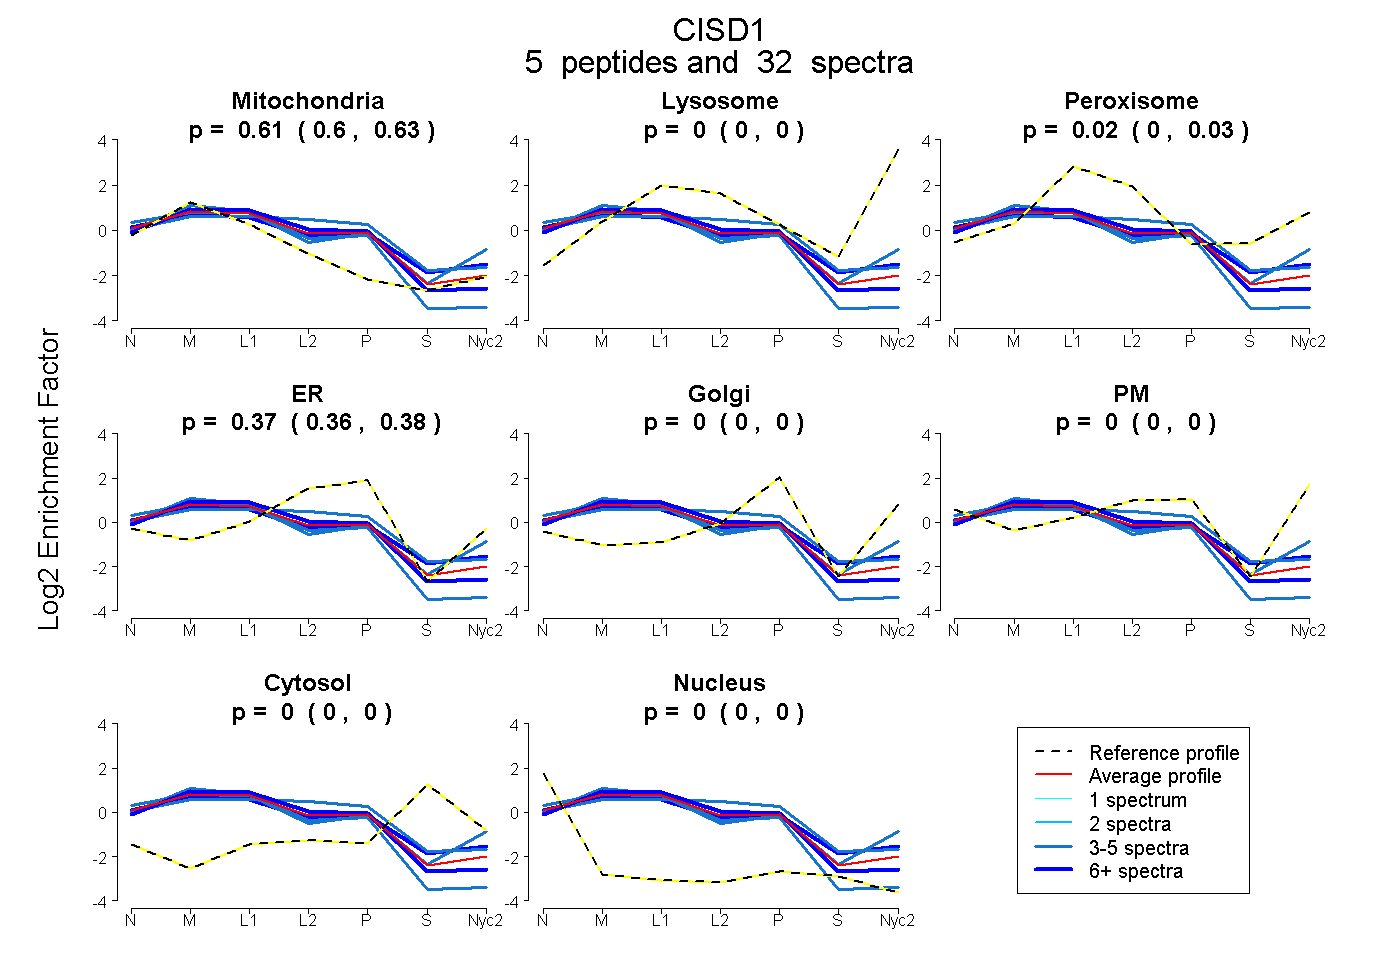
0.599 | 0.626
0.000 | 0.000
0.000 | 0.032
0.360 | 0.376
0.000 | 0.000
0.000 | 0.000
0.000 | 0.000
0.000 | 0.000
5peptides
spectra
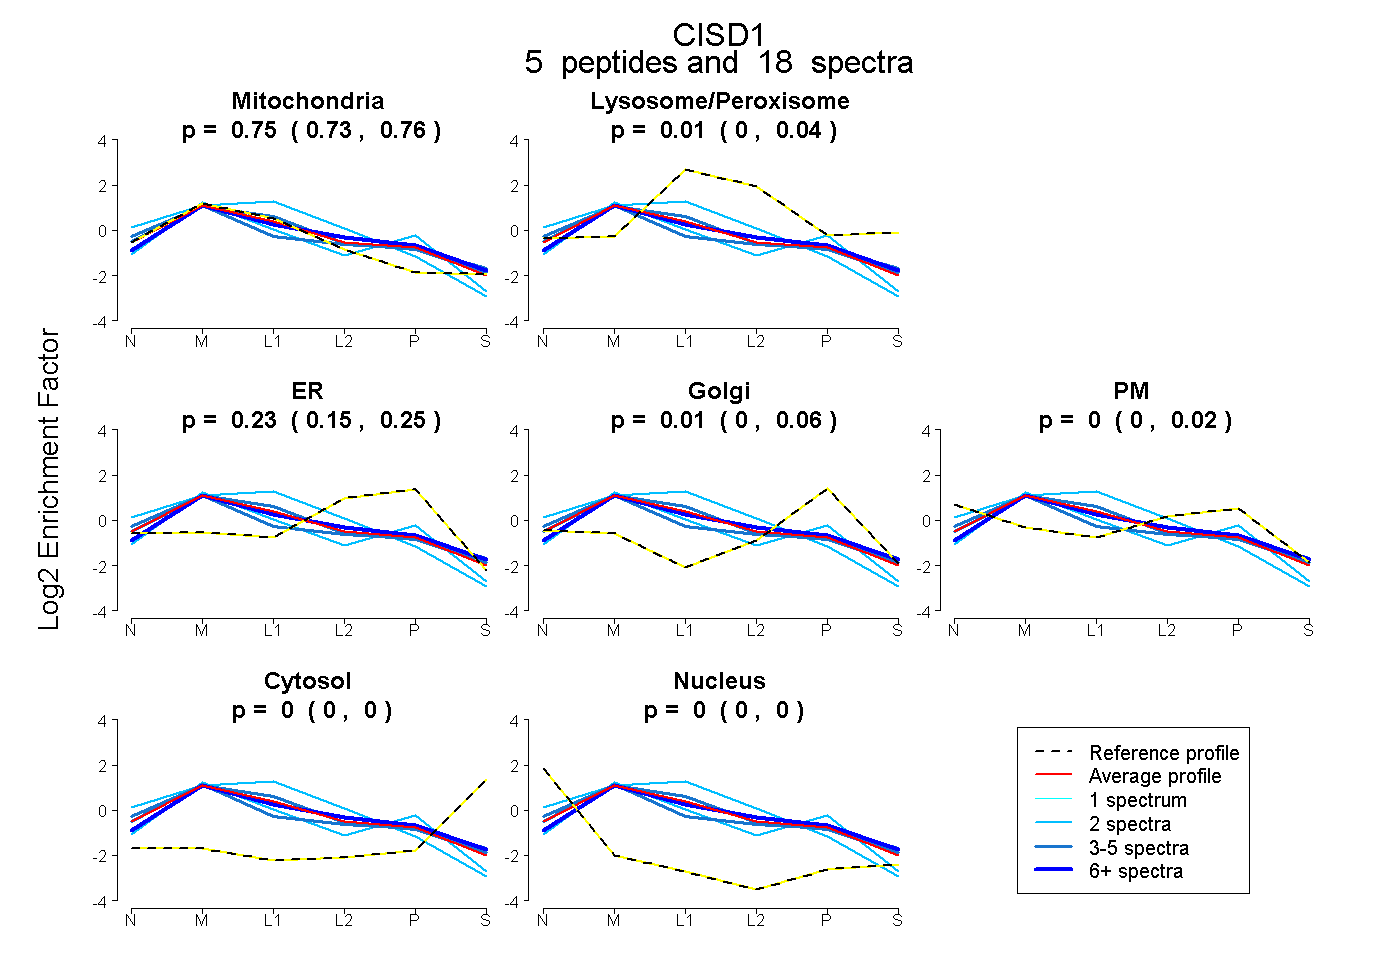
0.725 | 0.758
0.000 | 0.039
0.151 | 0.254
0.000 | 0.065
0.000 | 0.017
0.000 | 0.000
0.000 | 0.000