7
7peptides
spectra
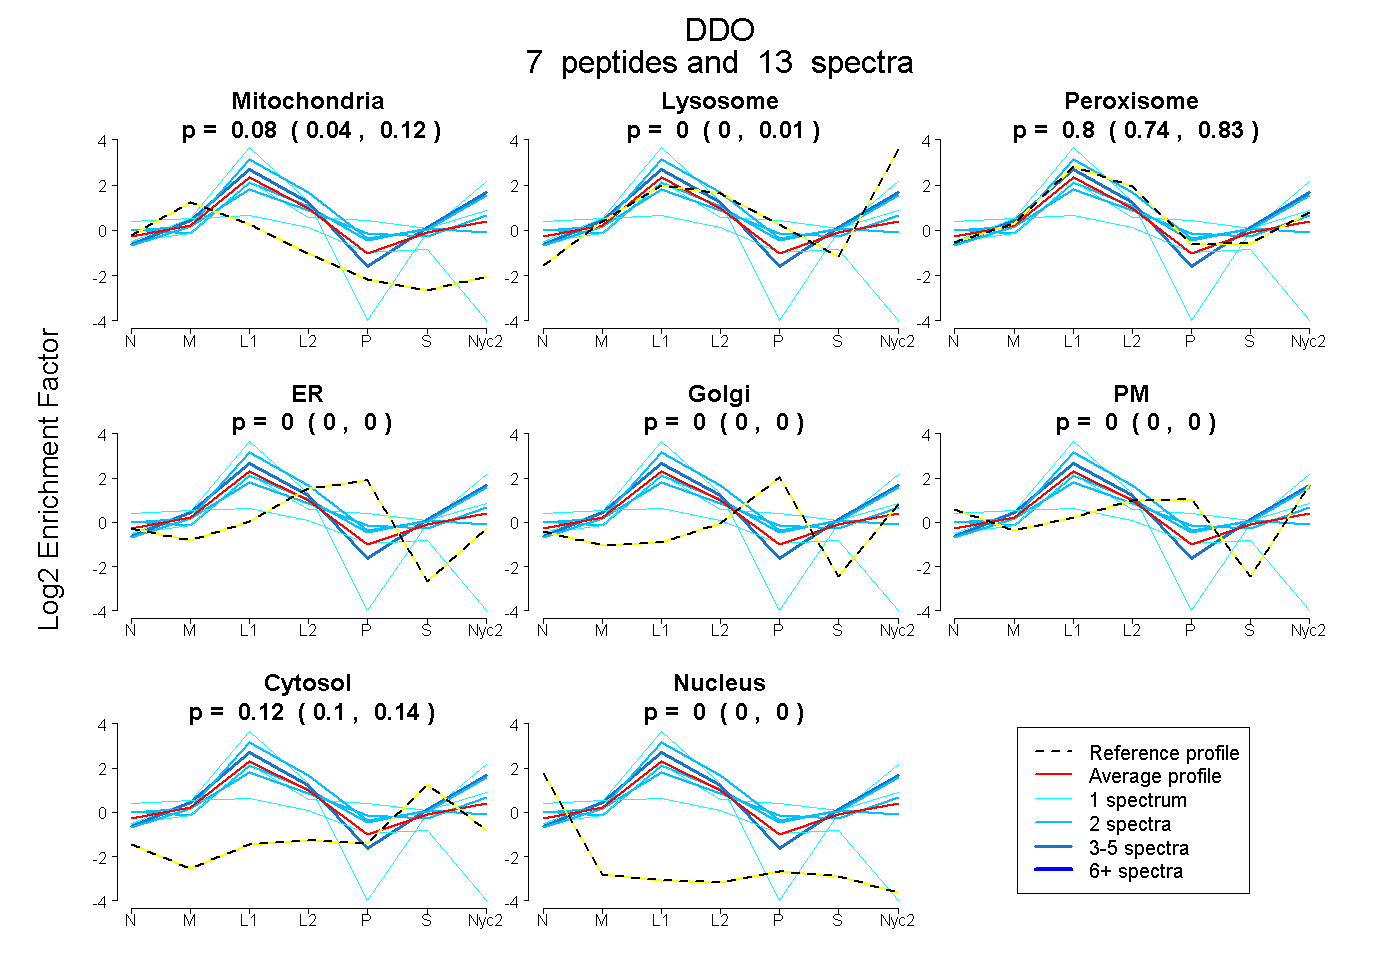
0.035 | 0.119
0.000 | 0.012
0.744 | 0.830
0.000 | 0.000
0.000 | 0.000
0.000 | 0.000
0.105 | 0.141
0.000 | 0.000
2peptides
spectra
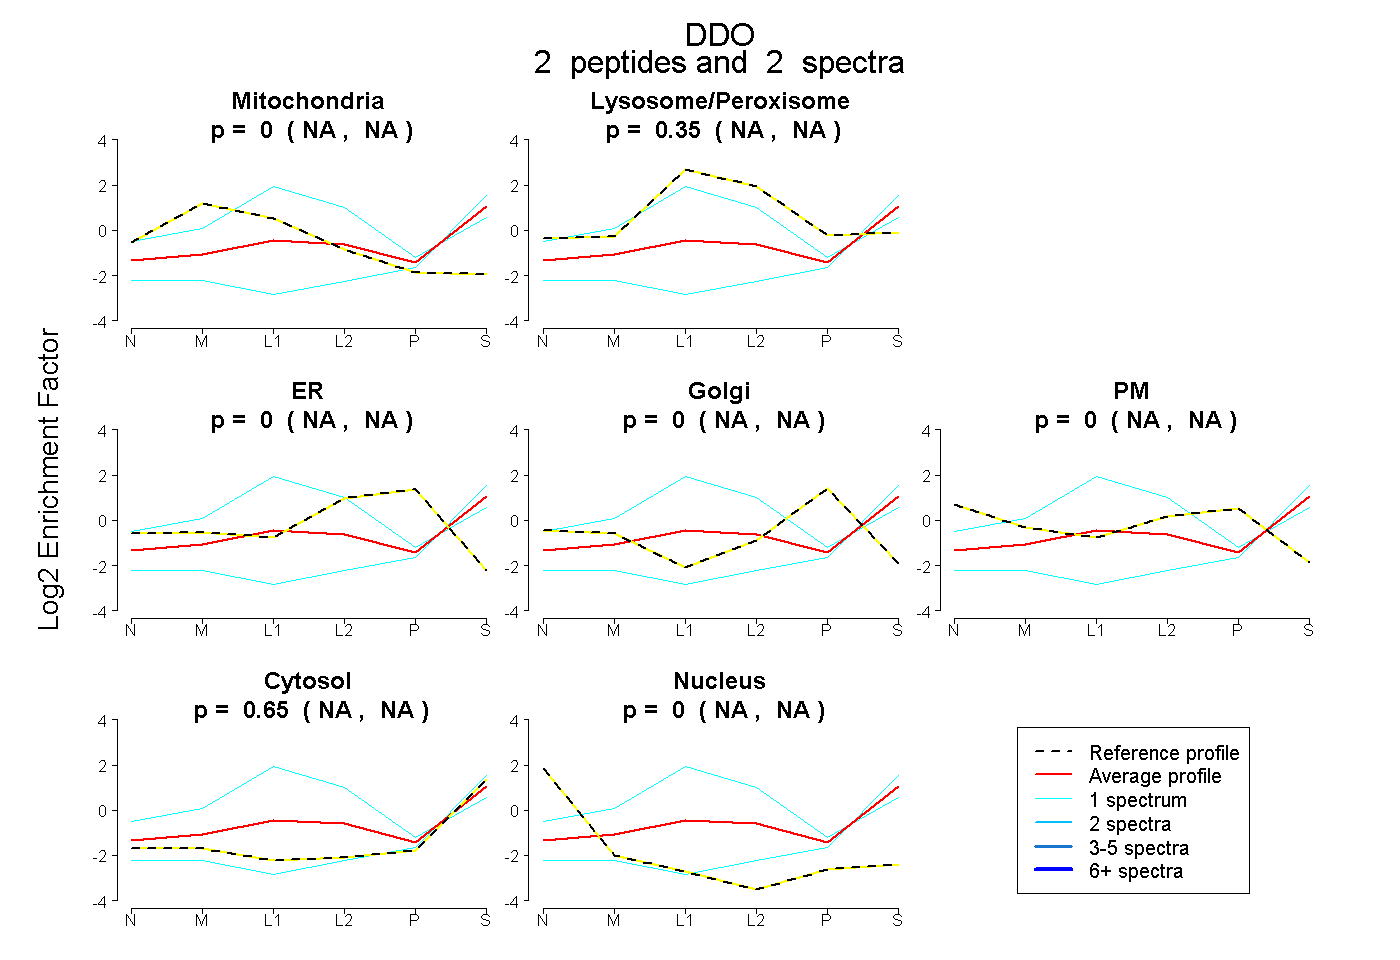
NA | NA
NA | NA
NA | NA
NA | NA
NA | NA
NA | NA
NA | NA
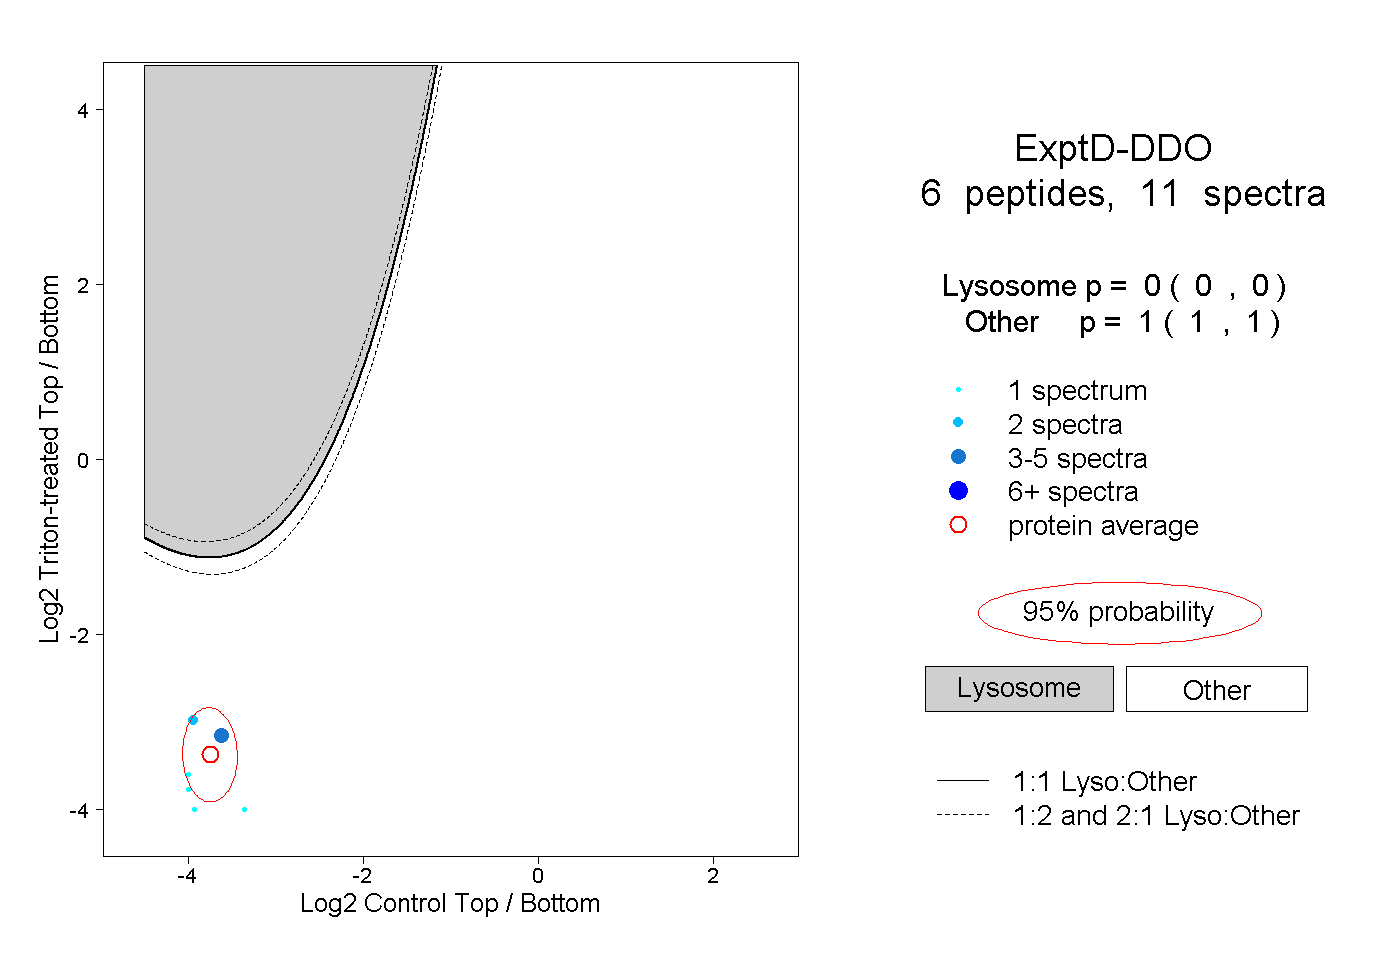
11peptides
spectra
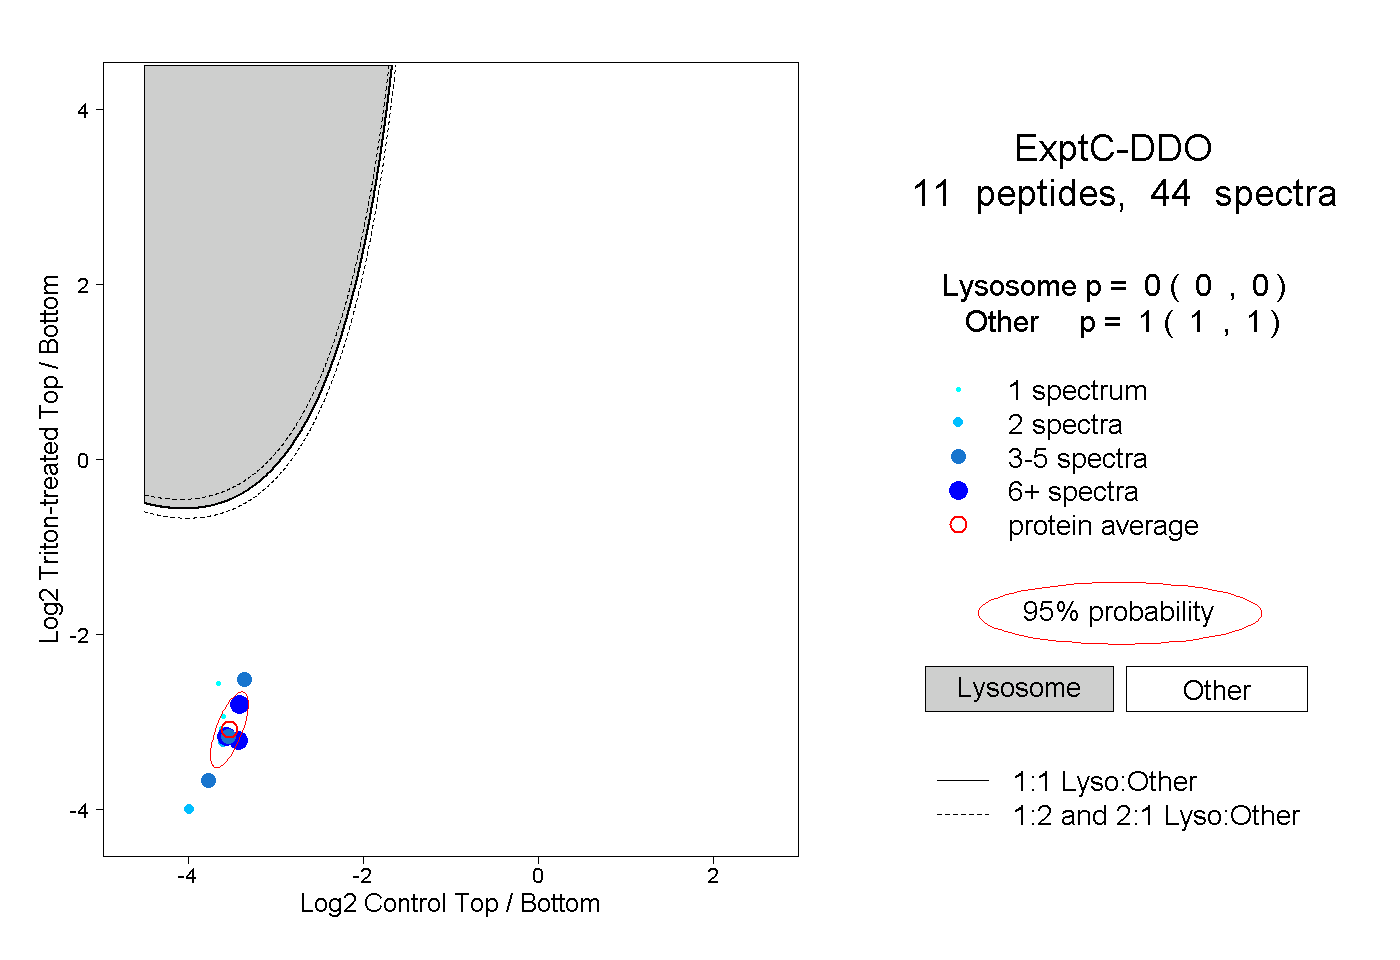
0.000 | 0.000
1.000 | 1.000