 7
7peptides
spectra
0.035 | 0.119
0.000 | 0.012
0.744 | 0.830
0.000 | 0.000
0.000 | 0.000
0.000 | 0.000
0.105 | 0.141
0.000 | 0.000
| Plot | Mito | Lyso | Perox | ER | Golgi | PM | Cytosol | Nucleus | |||||
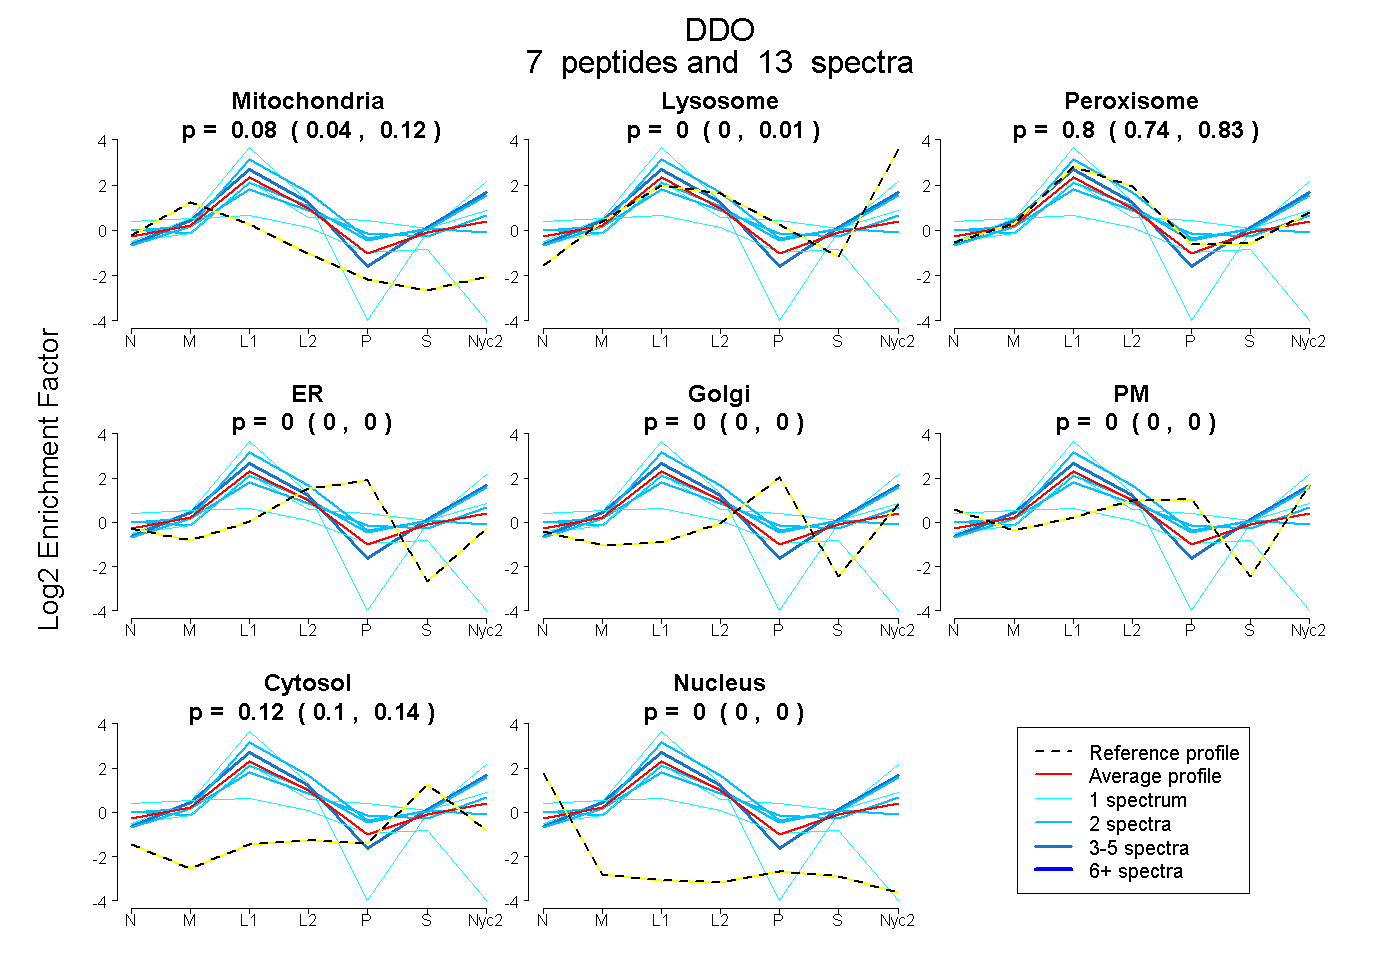
| Expt A |
7 peptides |
13 spectra |
|
0.080 0.035 | 0.119 |
0.000 0.000 | 0.012 |
0.796 0.744 | 0.830 |
0.000 0.000 | 0.000 |
0.000 0.000 | 0.000 |
0.000 0.000 | 0.000 |
0.124 0.105 | 0.141 |
0.000 0.000 | 0.000 |
| 1 spectrum, FPQYEFGQAFTTLK | 0.000 | 0.091 | 0.646 | 0.000 | 0.122 | 0.000 | 0.142 | 0.000 | ||
| 2 spectra, SAEAVDAGIHLVSGWQIFR | 0.000 | 0.177 | 0.823 | 0.000 | 0.000 | 0.000 | 0.000 | 0.000 | ||
| 4 spectra, LVGDATVSPVR | 0.000 | 0.152 | 0.771 | 0.000 | 0.000 | 0.000 | 0.077 | 0.000 | ||
| 1 spectrum, QTGDWNLSPDAELSR | 0.606 | 0.000 | 0.157 | 0.062 | 0.000 | 0.000 | 0.065 | 0.111 | ||
| 2 spectra, LVMECVHTLR | 0.028 | 0.000 | 0.653 | 0.000 | 0.000 | 0.186 | 0.133 | 0.000 | ||
| 2 spectra, CSVTVISDR | 0.000 | 0.000 | 0.807 | 0.000 | 0.000 | 0.000 | 0.135 | 0.059 | ||
| 1 spectrum, DGGGLTYVYPGTSYVTLGGSR | 0.012 | 0.000 | 0.988 | 0.000 | 0.000 | 0.000 | 0.000 | 0.000 |
| Plot | Mito | Lyso or Perox | ER | Golgi | PM | Cytosol | Nucleus | ||||||
| Expt B |
2 peptides |
2 spectra |
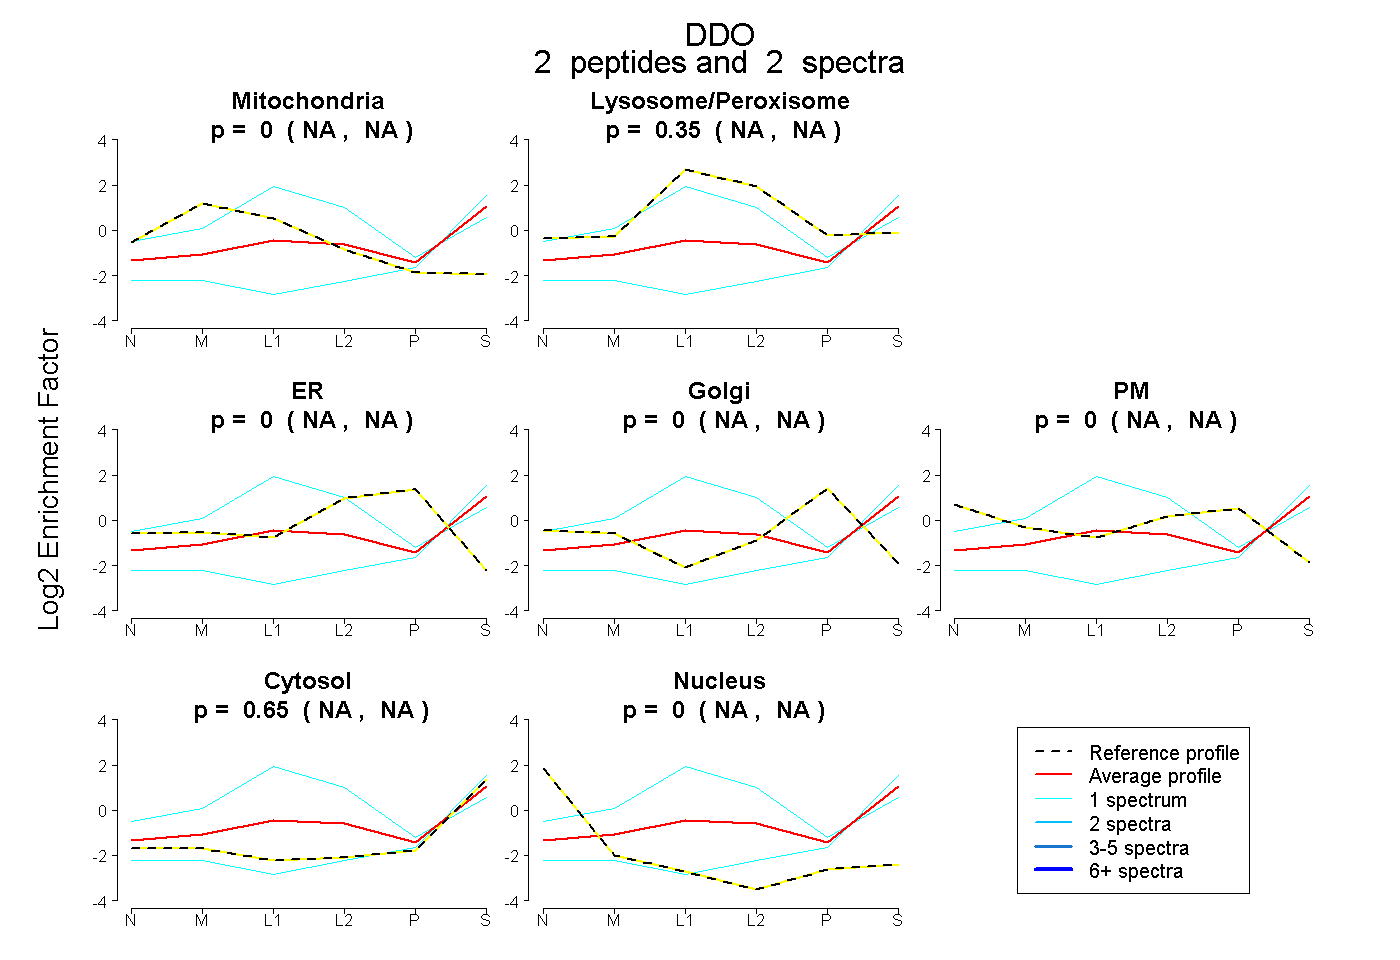 |
0.000 NA | NA |
0.349 NA | NA |
0.000 NA | NA |
0.000 NA | NA |
0.000 NA | NA |
0.651 NA | NA |
0.000 NA | NA |
|||
| Plot | Lyso | Other | |||||||||||
| Expt C |
11 peptides |
44 spectra |
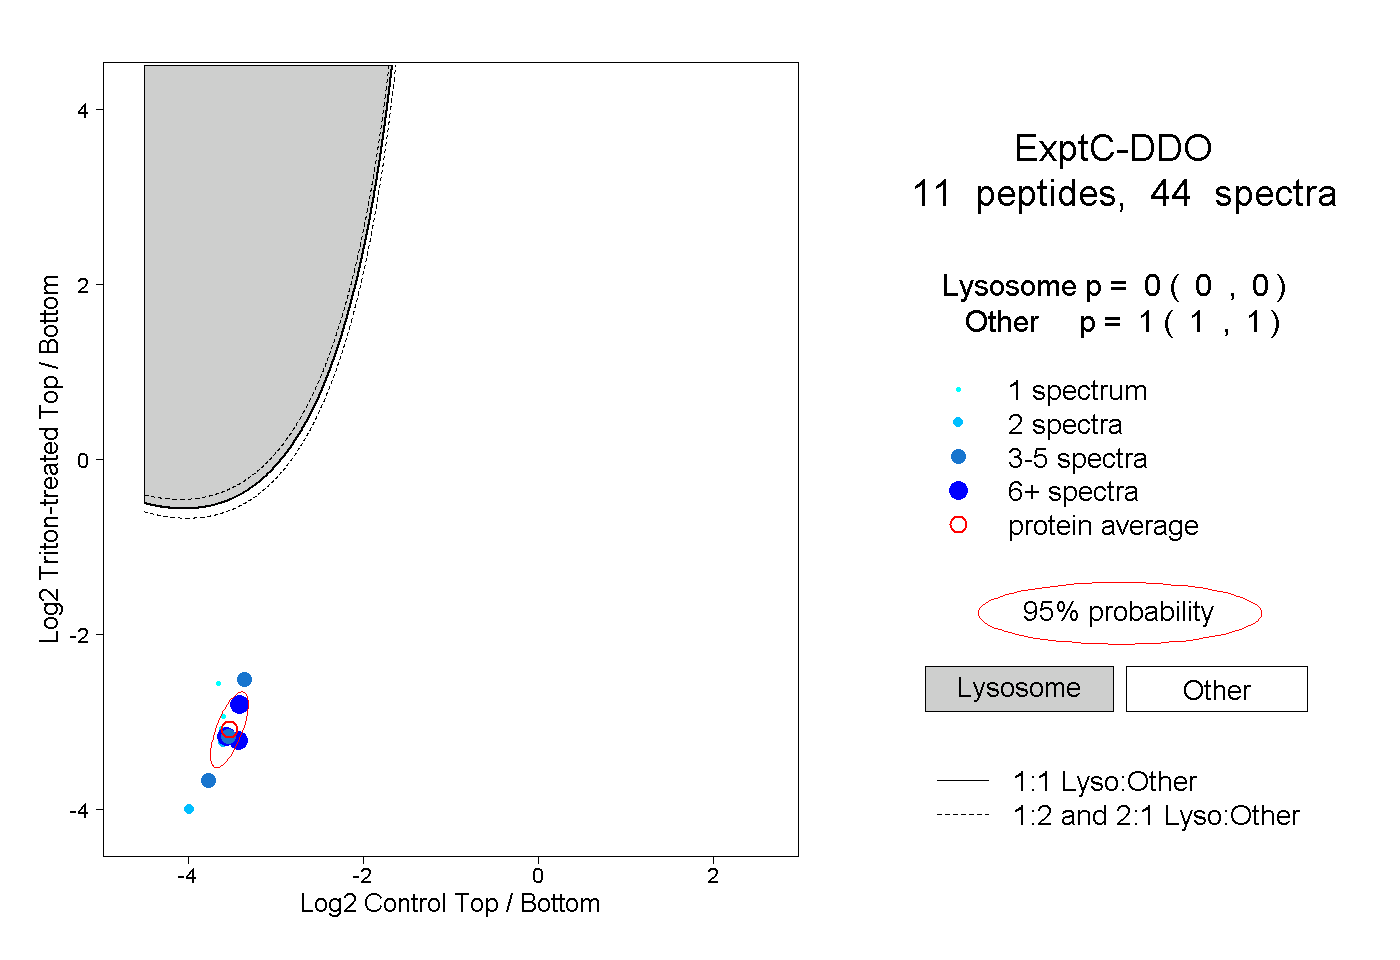 |
0.000 0.000 | 0.000 |
1.000 1.000 | 1.000 |
||||||||
| Plot | Lyso | Other | |||||||||||
| Expt D |
6 peptides |
11 spectra |
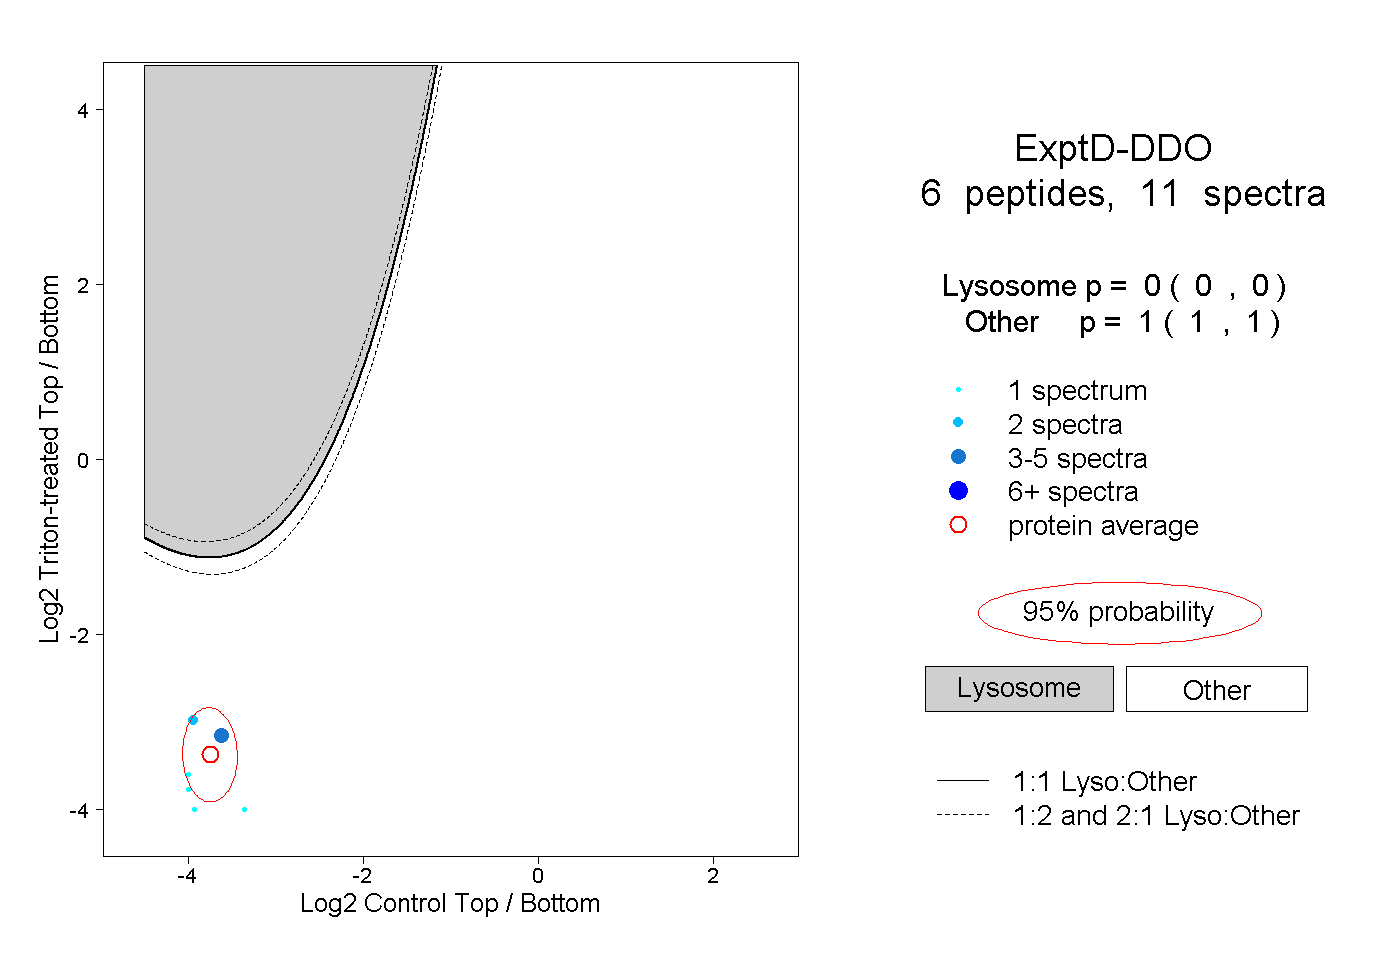 |
0.000 0.000 | 0.000 |
1.000 1.000 | 1.000 |