 5
5peptides
spectra
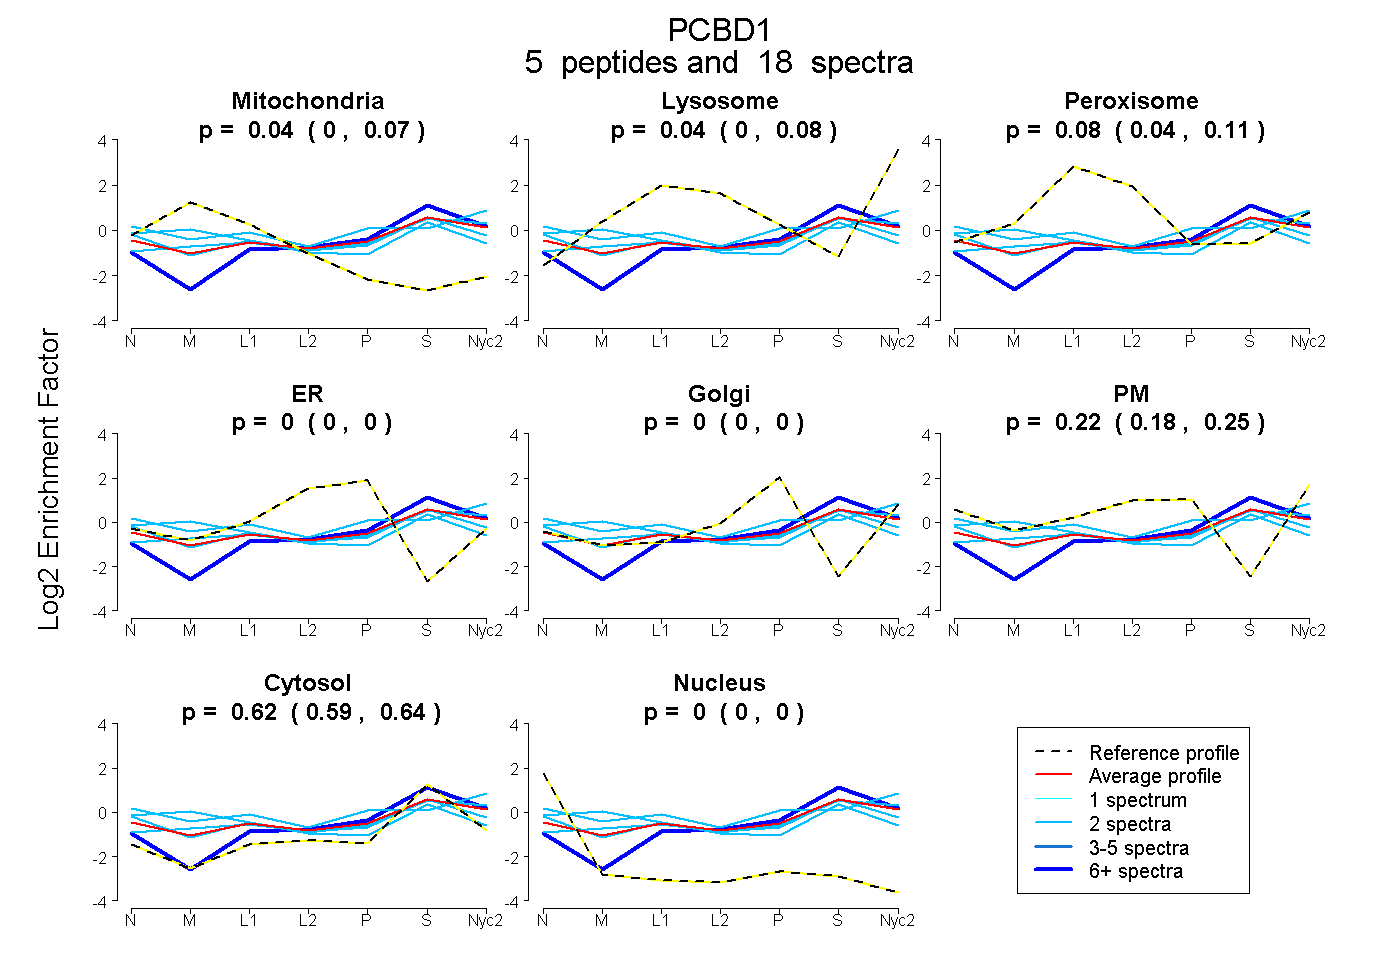
0.002 | 0.068
0.000 | 0.081
0.043 | 0.108
0.000 | 0.000
0.000 | 0.000
0.184 | 0.252
0.594 | 0.642
0.000 | 0.000
3peptides
spectra
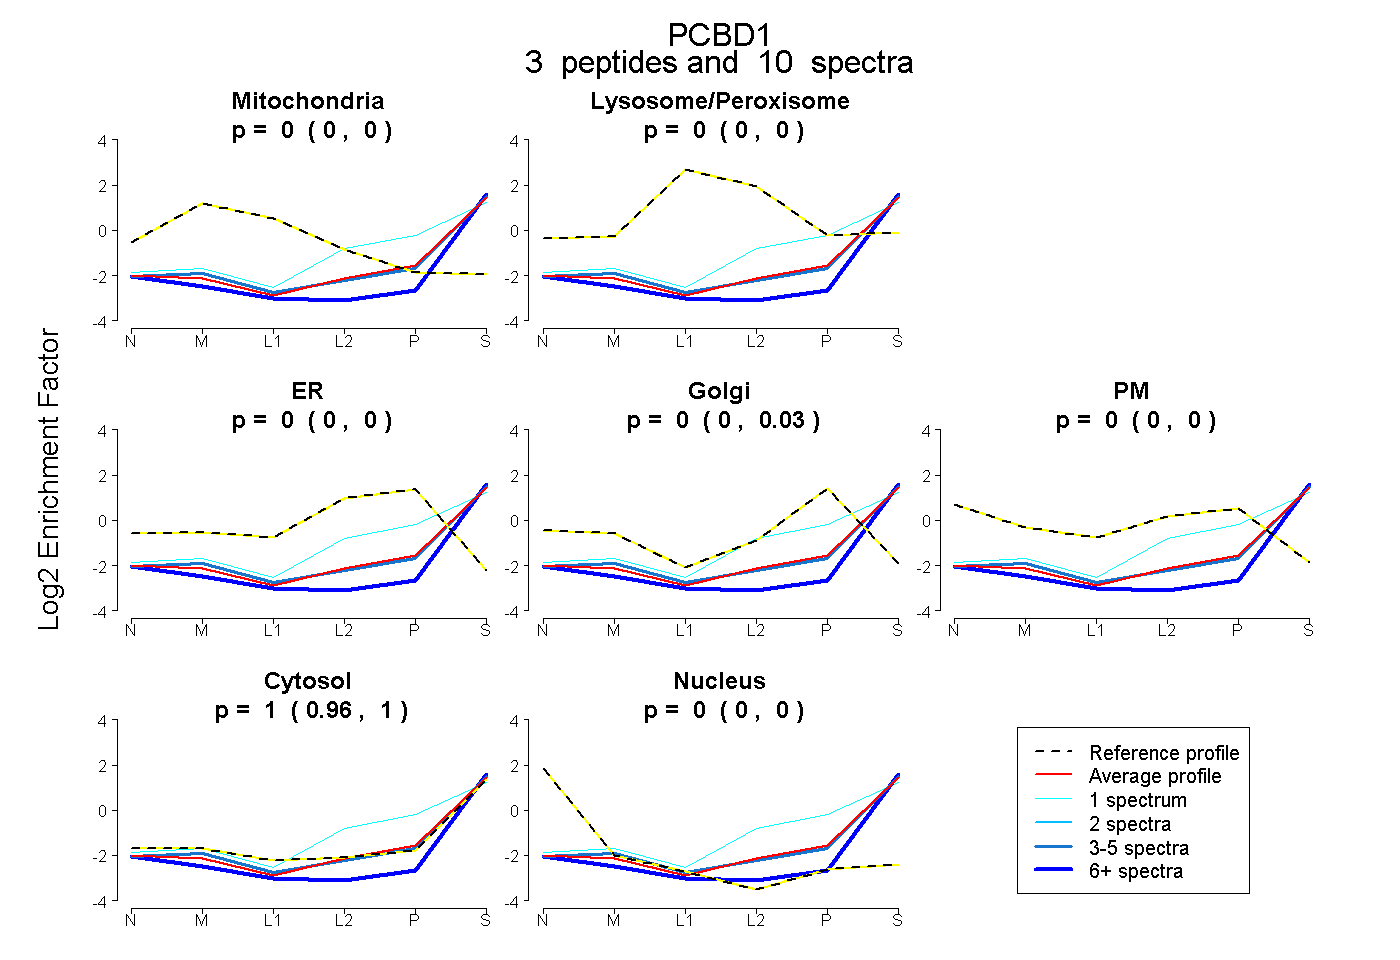
0.000 | 0.000
0.000 | 0.000
0.000 | 0.000
0.000 | 0.027
0.000 | 0.000
0.960 | 1.000
0.000 | 0.000
4peptides
spectra
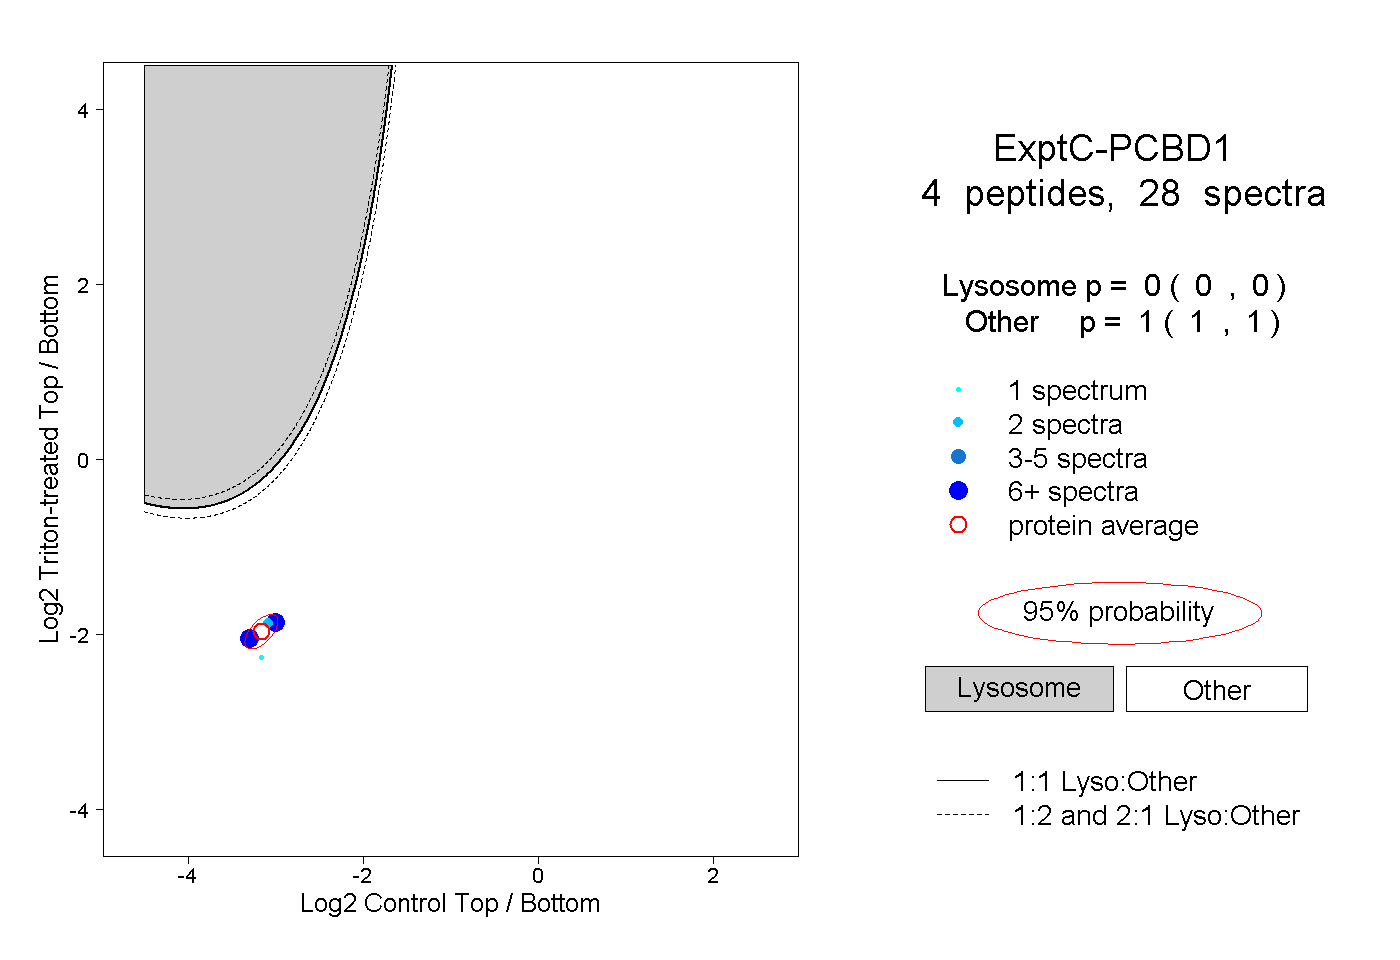
0.000 | 0.000
1.000 | 1.000
3peptides
spectra
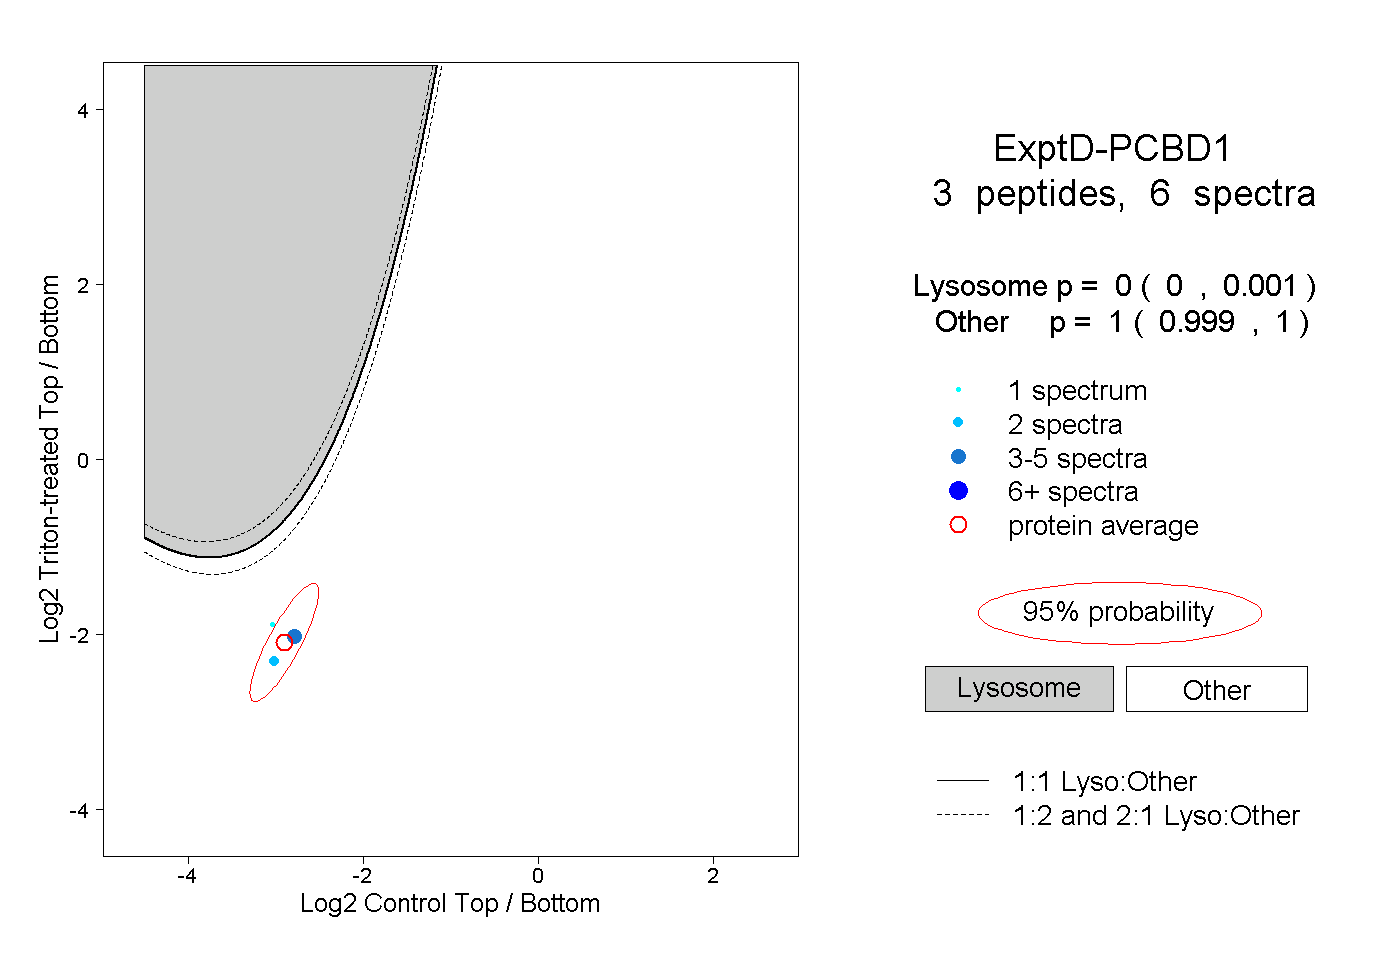
0.000 | 0.001
0.999 | 1.000