 14
14peptides
spectra
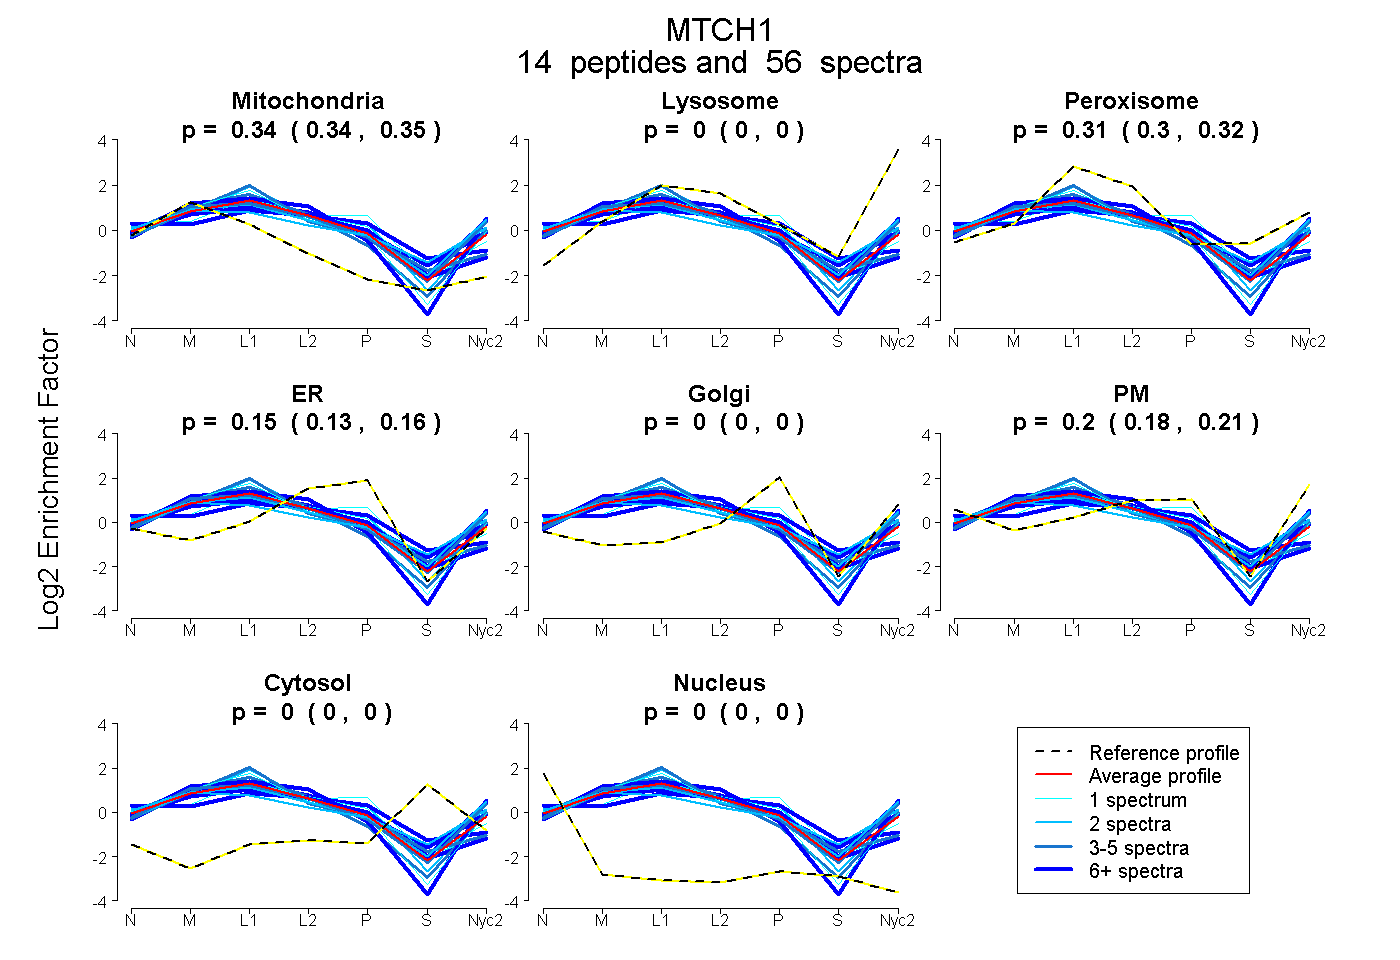
0.337 | 0.347
0.000 | 0.004
0.304 | 0.322
0.134 | 0.161
0.000 | 0.000
0.178 | 0.209
0.000 | 0.000
0.000 | 0.000
8peptides
spectra
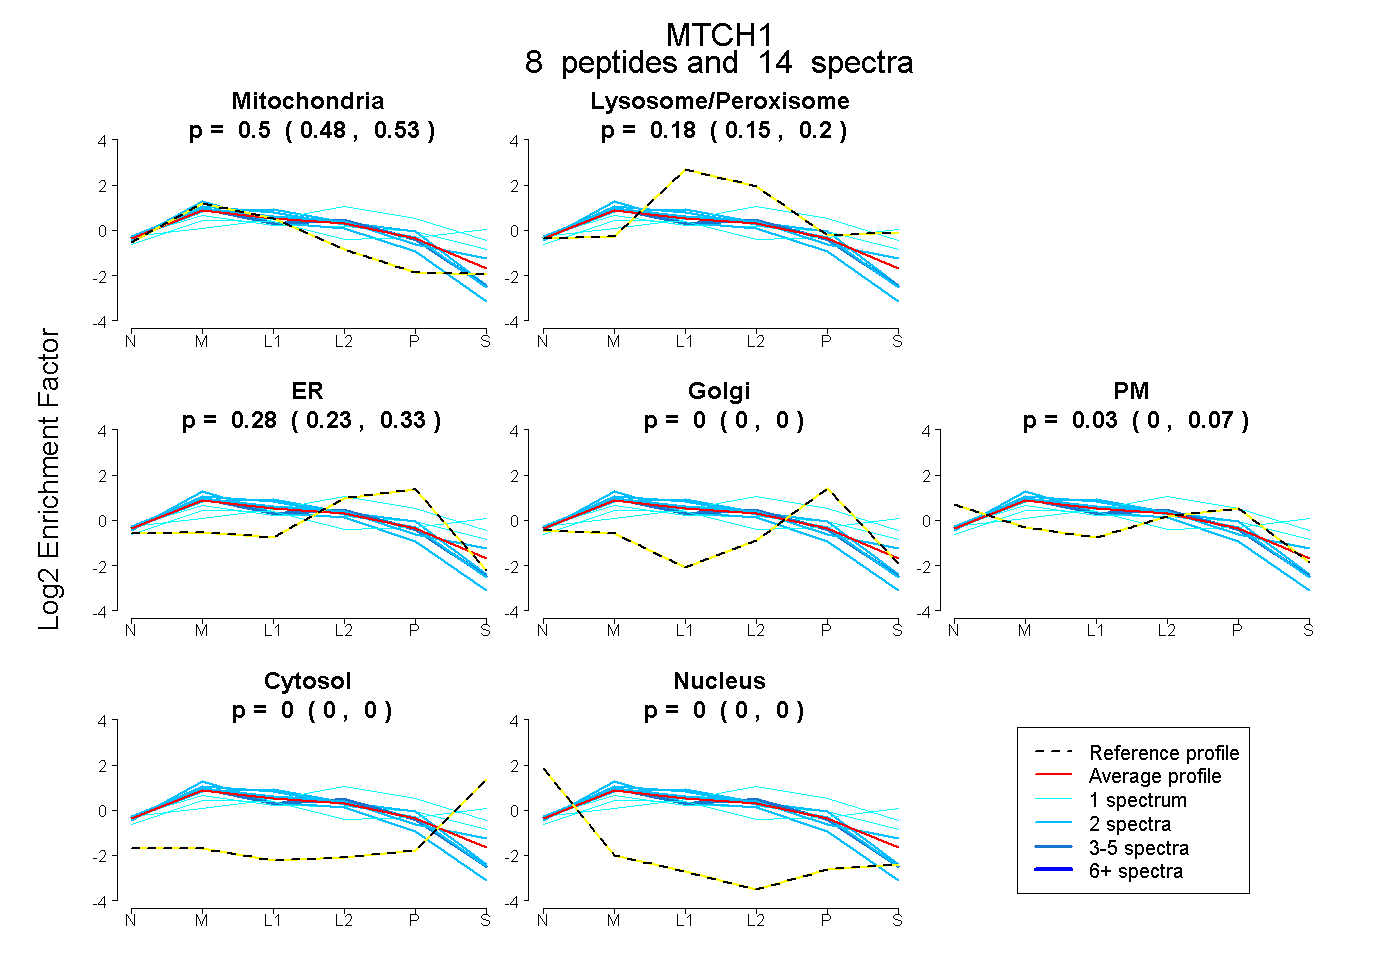
0.479 | 0.525
0.147 | 0.203
0.228 | 0.325
0.000 | 0.000
0.000 | 0.069
0.000 | 0.000
0.000 | 0.000
12peptides
spectra

0.000 | 0.060
0.935 | 1.000
