 14
14peptides
spectra
0.337 | 0.347
0.000 | 0.004
0.304 | 0.322
0.134 | 0.161
0.000 | 0.000
0.178 | 0.209
0.000 | 0.000
0.000 | 0.000
| Plot | Mito | Lyso | Perox | ER | Golgi | PM | Cytosol | Nucleus | |||||
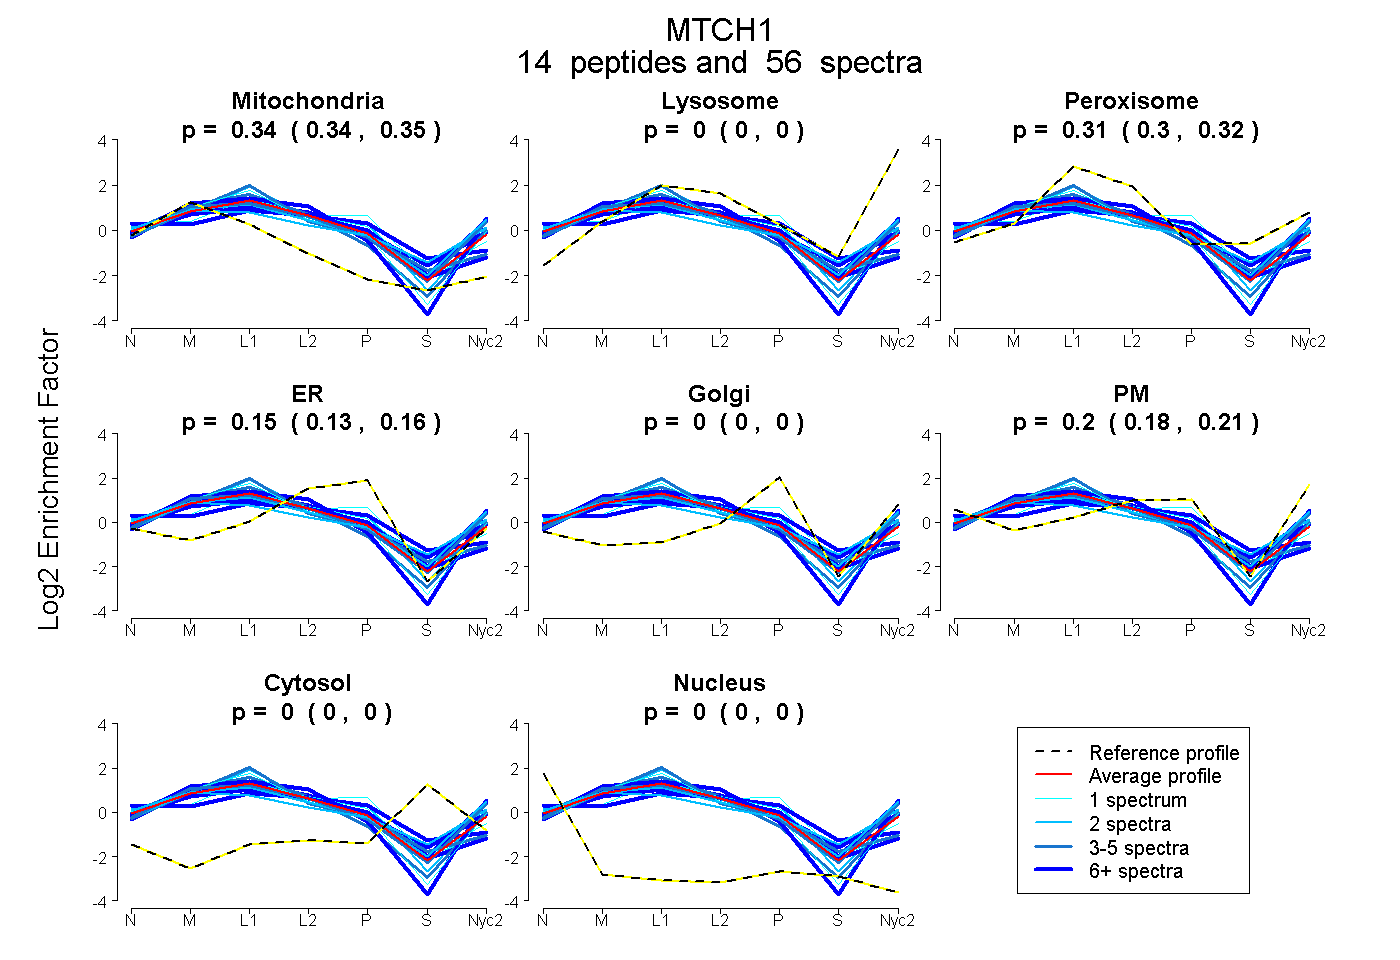
| Expt A |
14 peptides |
56 spectra |
|
0.342 0.337 | 0.347 |
0.000 0.000 | 0.004 |
0.314 0.304 | 0.322 |
0.148 0.134 | 0.161 |
0.000 0.000 | 0.000 |
0.195 0.178 | 0.209 |
0.000 0.000 | 0.000 |
0.000 0.000 | 0.000 |
| 4 spectra, YLSVQGQLFR | 0.382 | 0.189 | 0.167 | 0.051 | 0.000 | 0.210 | 0.000 | 0.000 | ||
| 1 spectrum, GGAPAGVEAR | 0.291 | 0.000 | 0.261 | 0.448 | 0.000 | 0.000 | 0.000 | 0.000 | ||
| 2 spectra, YSGVLSSIGK | 0.387 | 0.147 | 0.083 | 0.000 | 0.000 | 0.382 | 0.000 | 0.000 | ||
| 8 spectra, LMSNALSTVTR | 0.408 | 0.256 | 0.000 | 0.078 | 0.000 | 0.259 | 0.000 | 0.000 | ||
| 2 spectra, YIVQVDGK | 0.328 | 0.072 | 0.368 | 0.000 | 0.130 | 0.103 | 0.000 | 0.000 | ||
| 2 spectra, AAGMAGAGAGAGAR | 0.265 | 0.000 | 0.322 | 0.133 | 0.000 | 0.279 | 0.000 | 0.000 | ||
| 6 spectra, HPRPAAQPSAR | 0.217 | 0.000 | 0.338 | 0.364 | 0.000 | 0.000 | 0.025 | 0.056 | ||
| 7 spectra, CMVQFVGR | 0.441 | 0.000 | 0.311 | 0.249 | 0.000 | 0.000 | 0.000 | 0.000 | ||
| 1 spectrum, LLIQVGHEPMPPTLGTNVLGR | 0.331 | 0.000 | 0.270 | 0.297 | 0.000 | 0.103 | 0.000 | 0.000 | ||
| 5 spectra, SWIHCWK | 0.411 | 0.000 | 0.434 | 0.155 | 0.000 | 0.000 | 0.000 | 0.000 | ||
| 6 spectra, MLAHPLHVISMR | 0.298 | 0.118 | 0.195 | 0.079 | 0.000 | 0.310 | 0.000 | 0.000 | ||
| 5 spectra, GSSLLFR | 0.421 | 0.046 | 0.264 | 0.000 | 0.000 | 0.269 | 0.000 | 0.000 | ||
| 6 spectra, ETSYEMMMQCVSR | 0.299 | 0.000 | 0.379 | 0.134 | 0.007 | 0.182 | 0.000 | 0.000 | ||
| 1 spectrum, VLYLPSFFTYAK | 0.401 | 0.044 | 0.204 | 0.079 | 0.000 | 0.273 | 0.000 | 0.000 |
| Plot | Mito | Lyso or Perox | ER | Golgi | PM | Cytosol | Nucleus | ||||||
| Expt B |
8 peptides |
14 spectra |
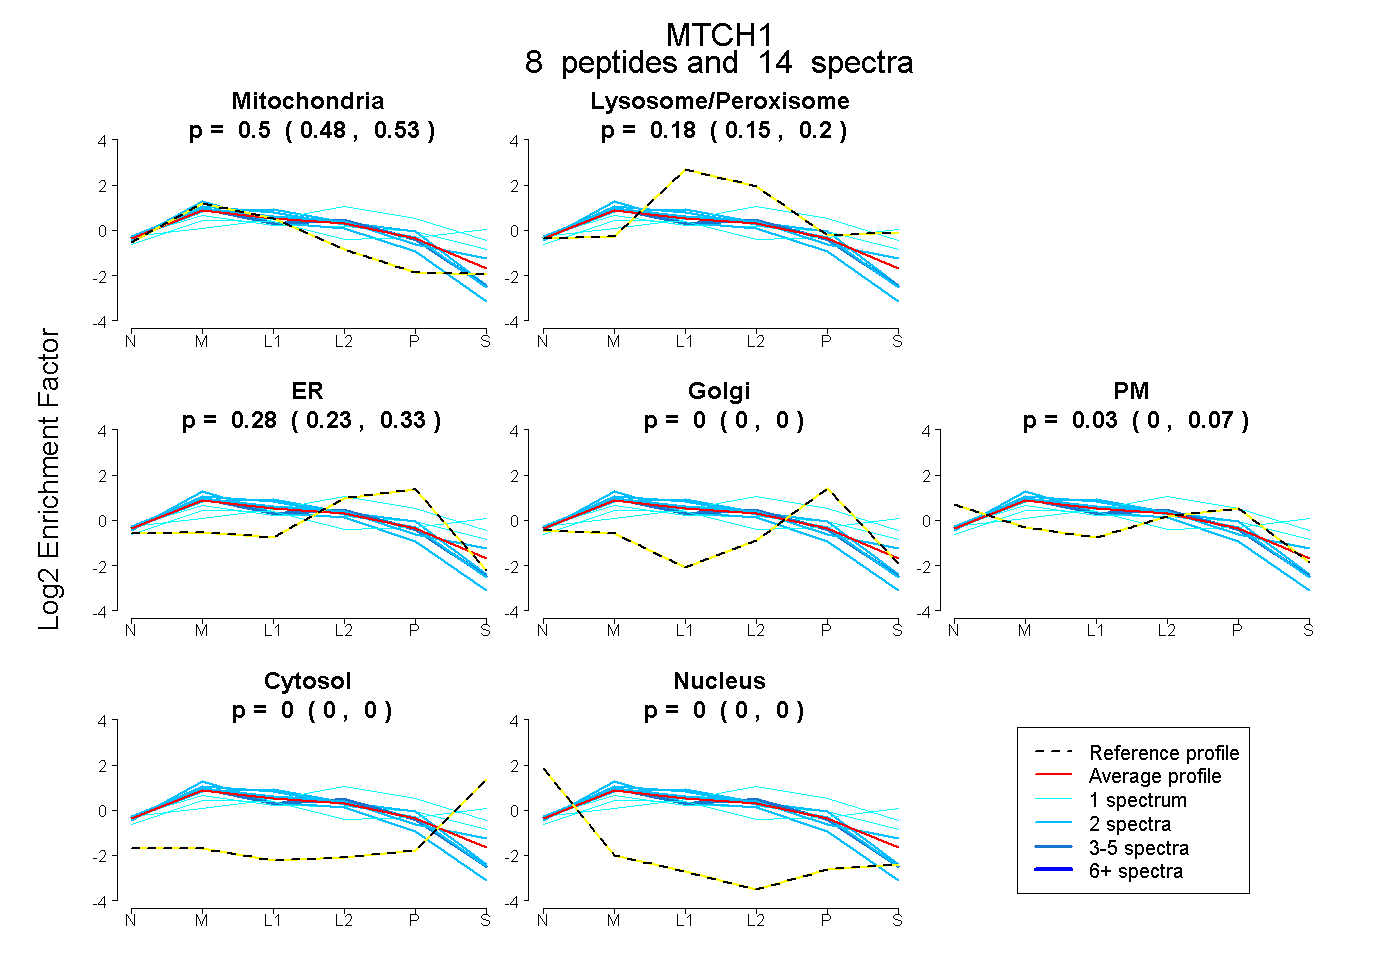 |
0.505 0.479 | 0.525 |
0.176 0.147 | 0.203 |
0.284 0.228 | 0.325 |
0.000 0.000 | 0.000 |
0.034 0.000 | 0.069 |
0.000 0.000 | 0.000 |
0.000 0.000 | 0.000 |
|||
| Plot | Lyso | Other | |||||||||||
| Expt C |
12 peptides |
87 spectra |
 |
0.003 0.000 | 0.060 |
0.997 0.935 | 1.000 |
||||||||
| Plot | Lyso | Other | |||||||||||
| Expt D |
5 peptides |
12 spectra |
 |
0.024 0.002 | 0.192 |
0.976 0.808 | 0.998 |