 6
6peptides
spectra
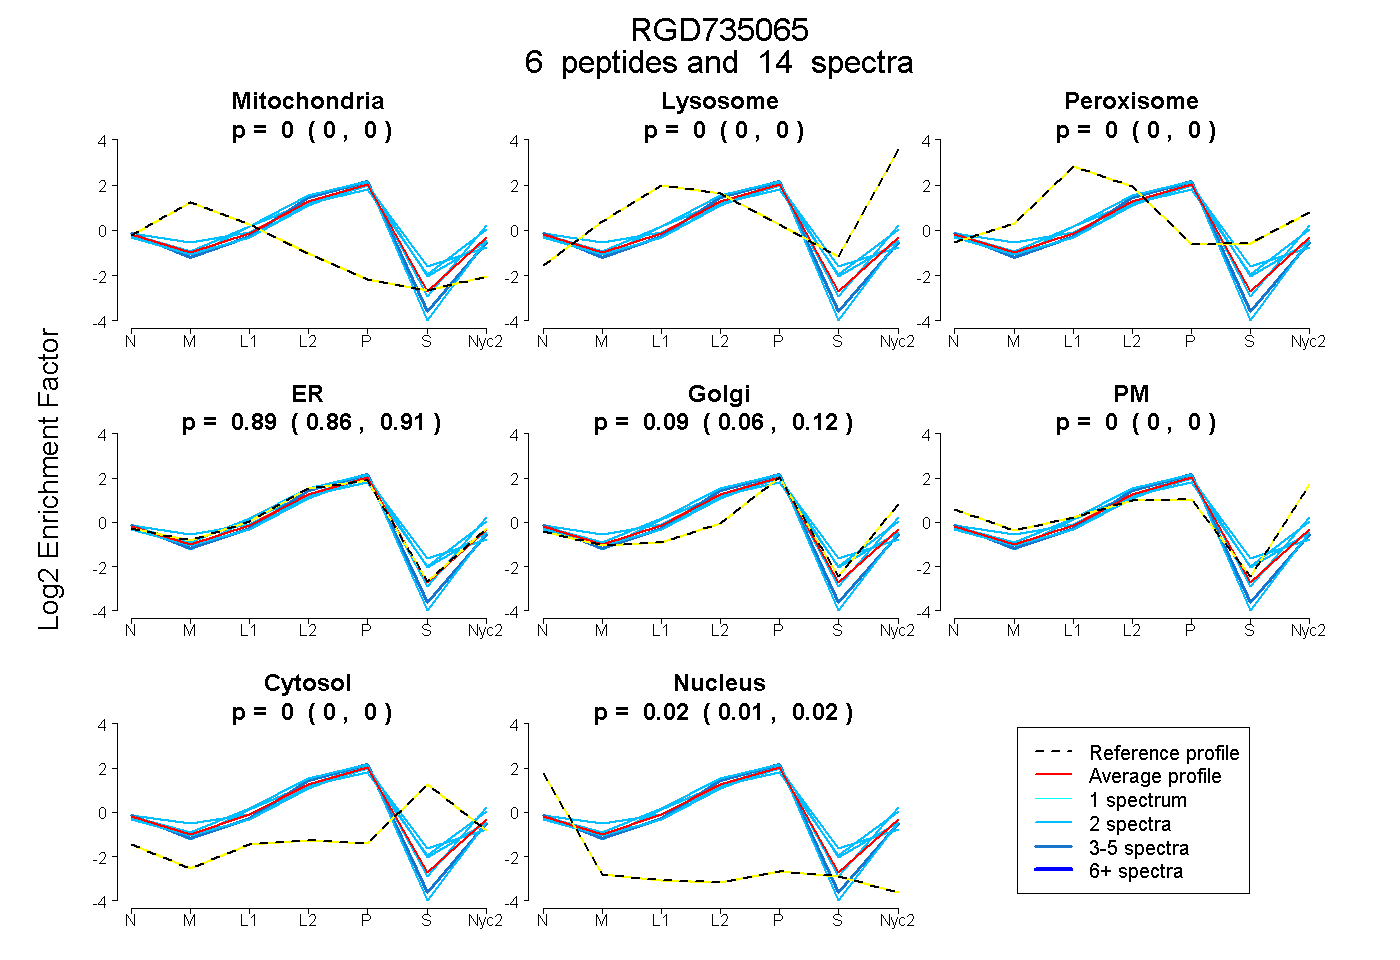
0.000 | 0.000
0.000 | 0.000
0.000 | 0.000
0.860 | 0.909
0.064 | 0.120
0.000 | 0.000
0.000 | 0.002
0.011 | 0.025
6peptides
spectra
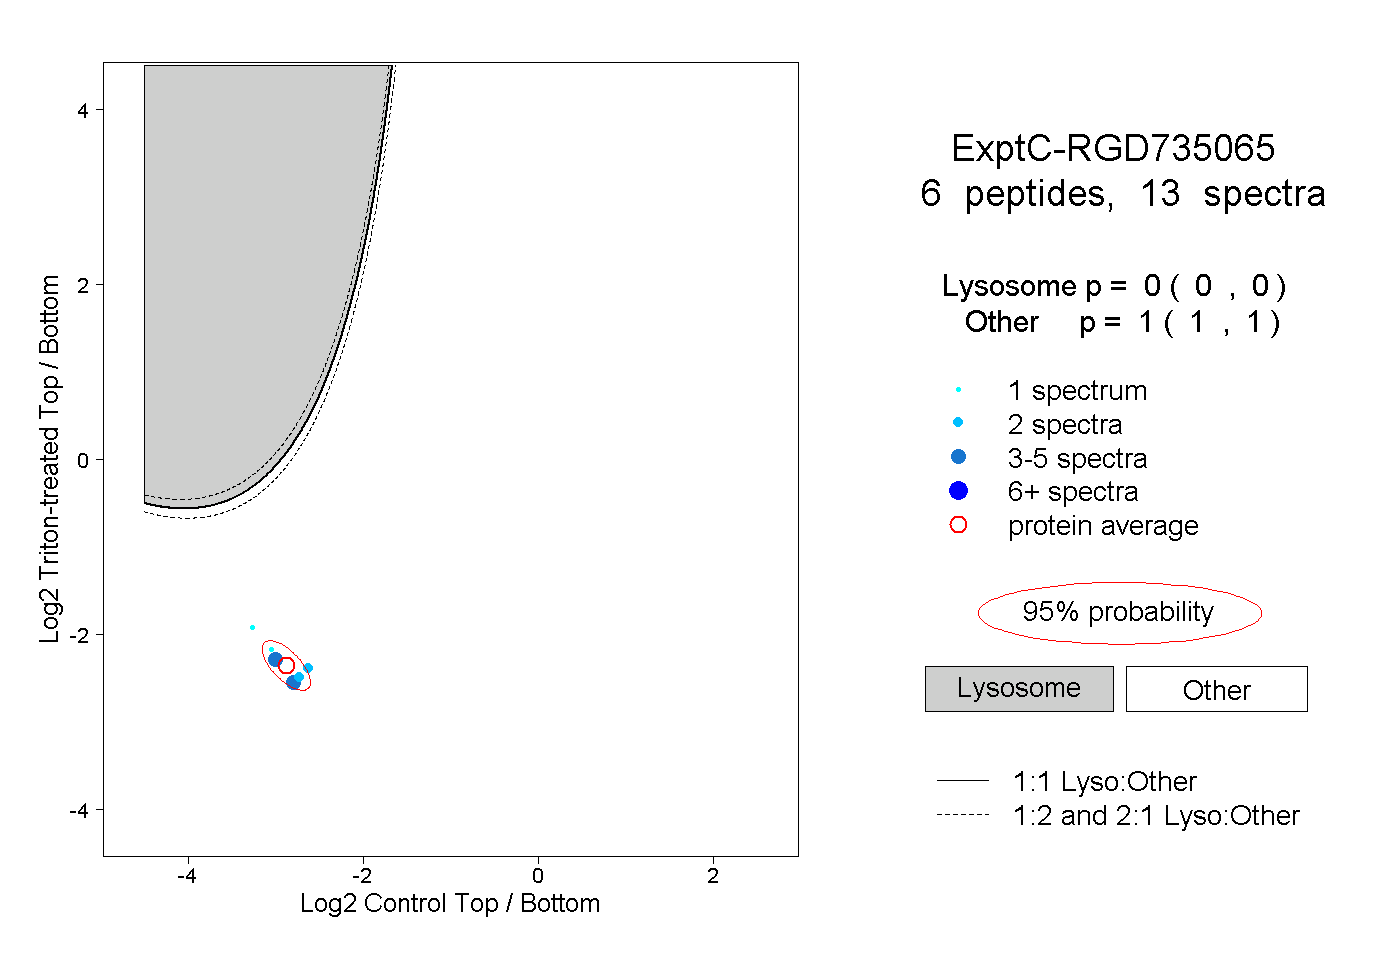
0.000 | 0.000
1.000 | 1.000
1peptide
spectrum
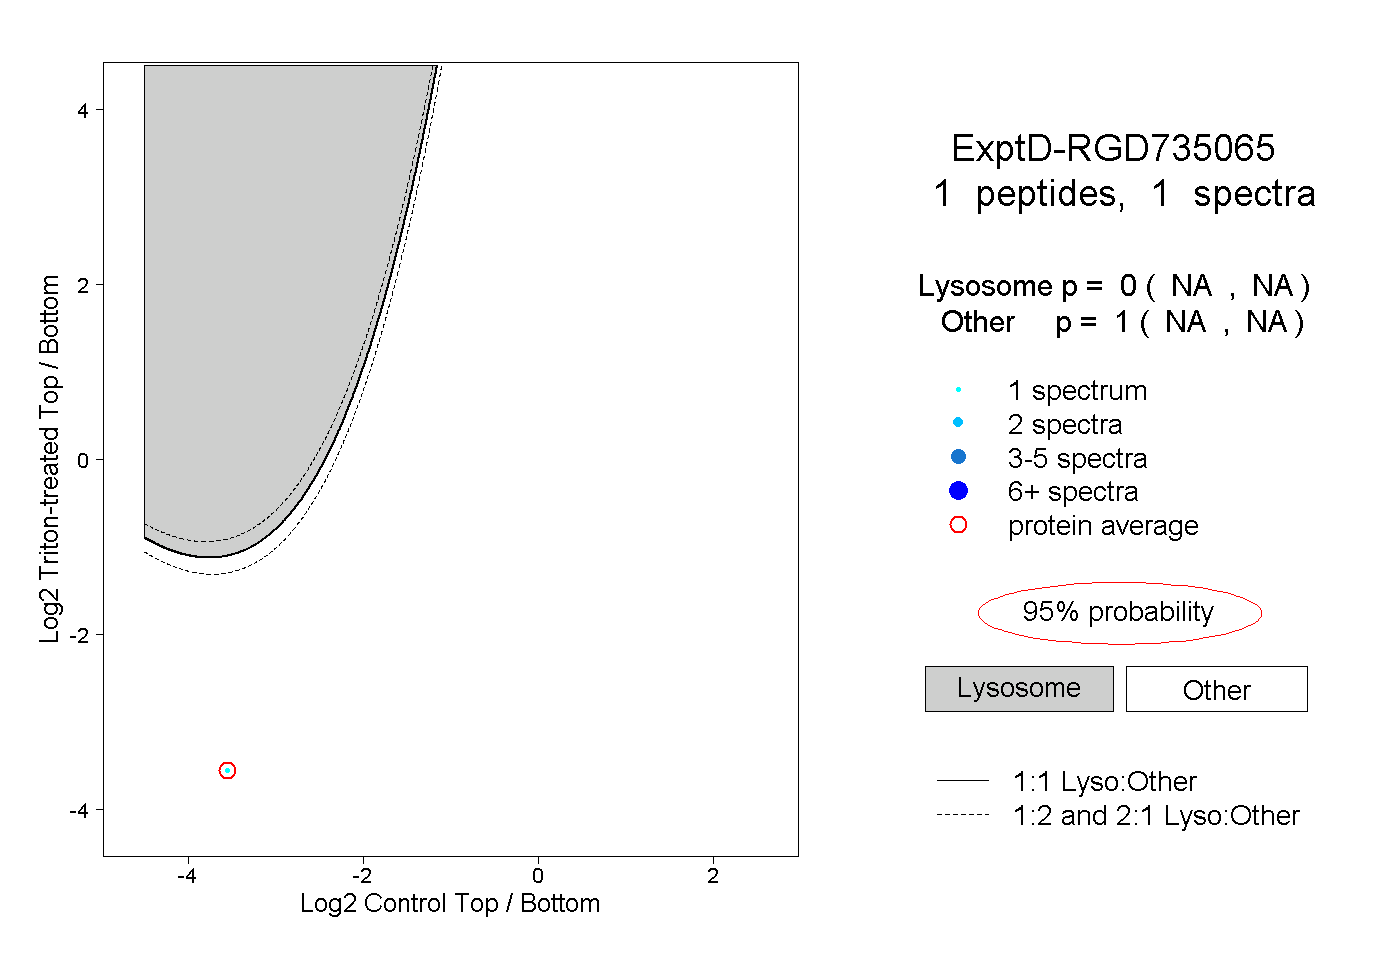
NA | NA
NA | NA