 5
5peptides
spectra
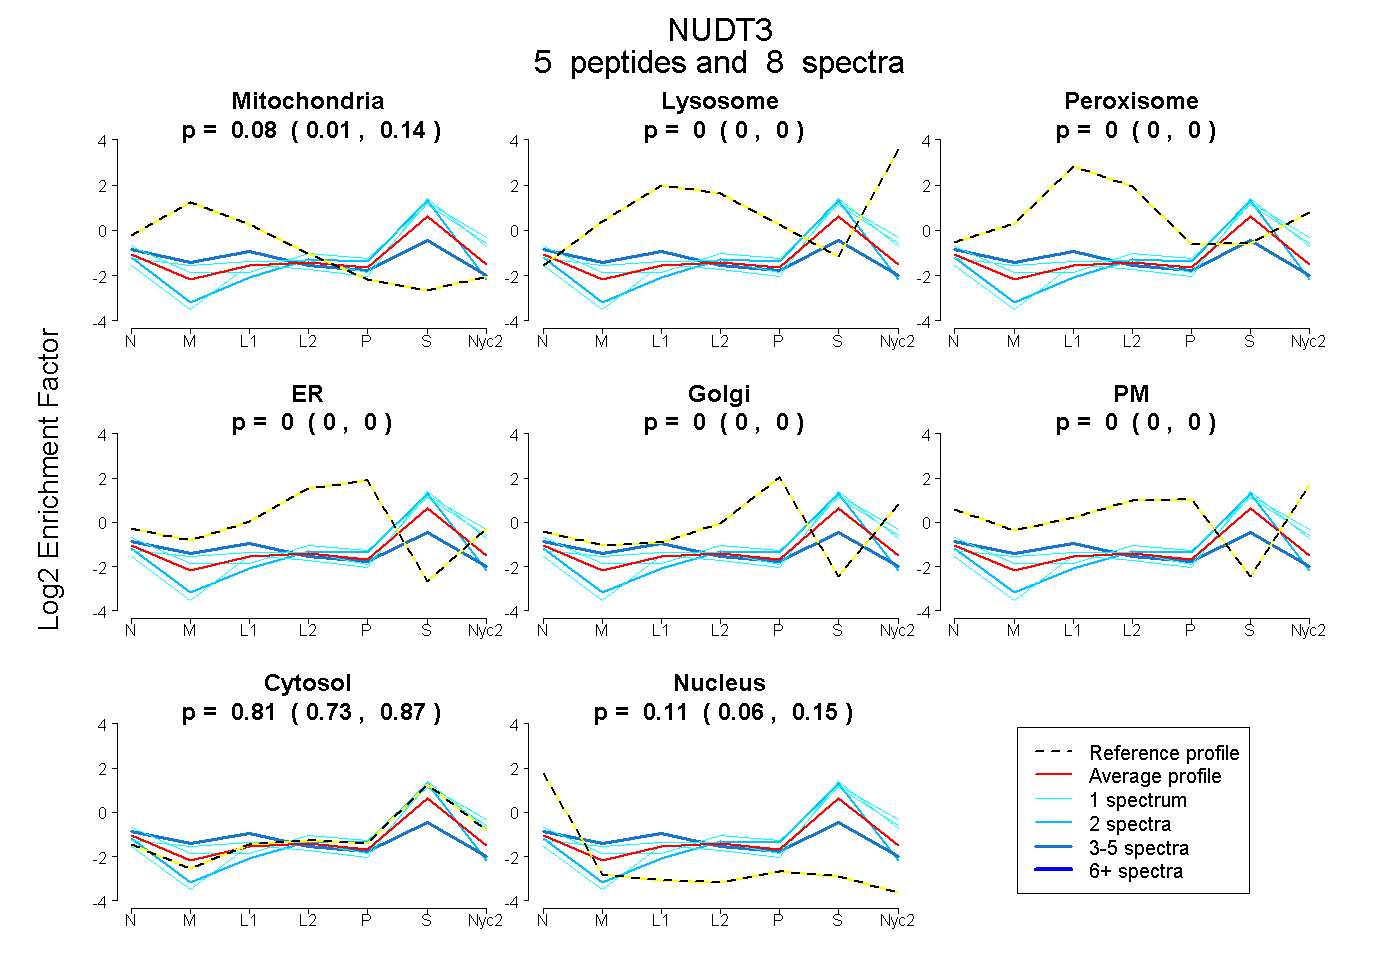
0.008 | 0.136
0.000 | 0.000
0.000 | 0.000
0.000 | 0.005
0.000 | 0.000
0.000 | 0.000
0.734 | 0.871
0.060 | 0.154
4peptides
spectra
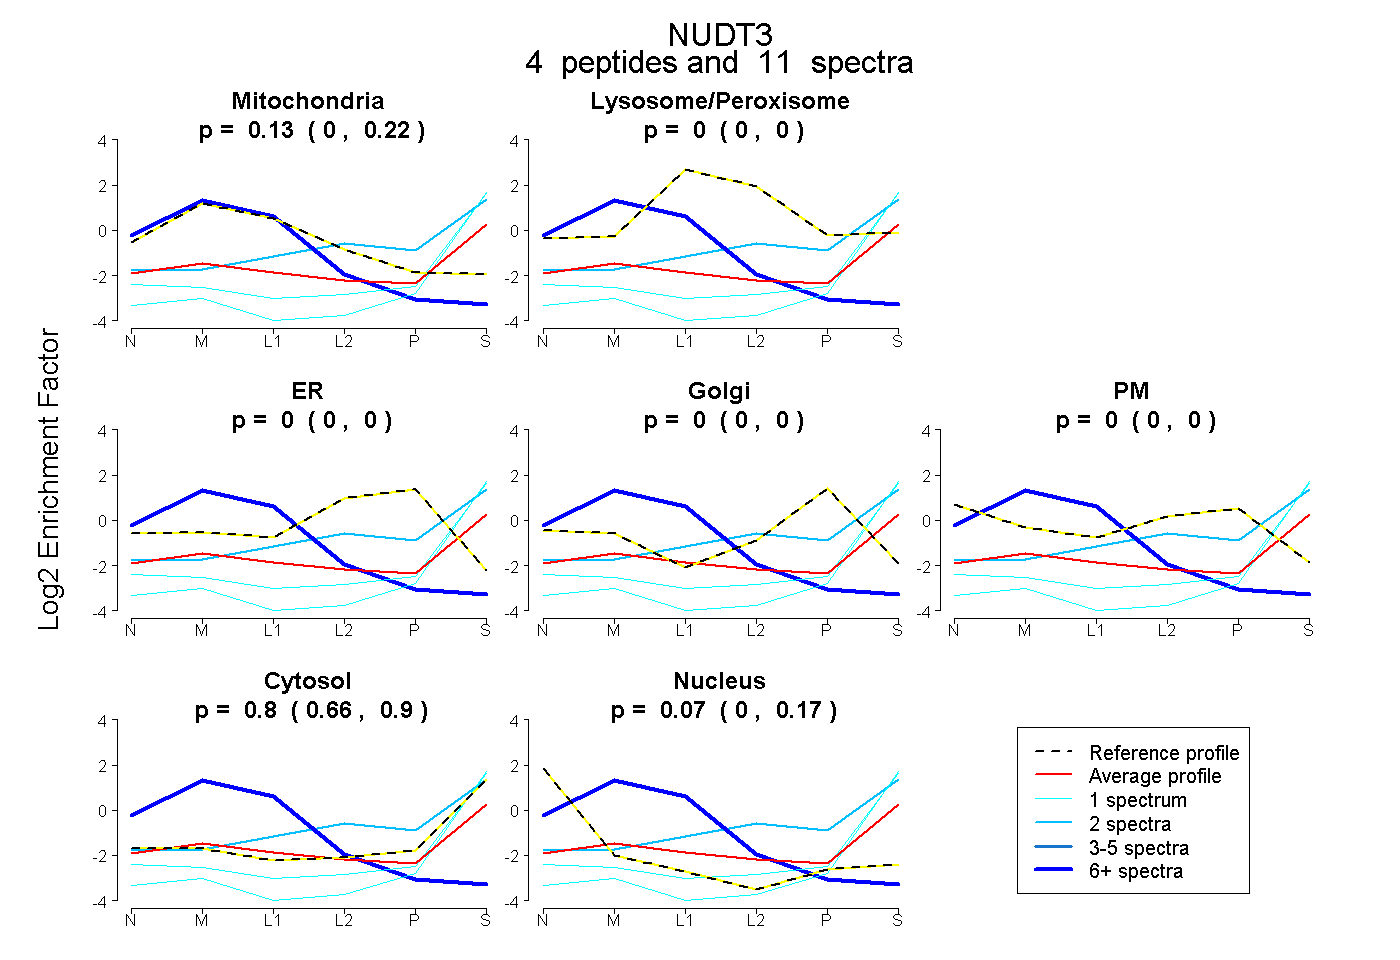
0.005 | 0.222
0.000 | 0.000
0.000 | 0.000
0.000 | 0.000
0.000 | 0.000
0.658 | 0.904
0.000 | 0.168
1peptide
spectra
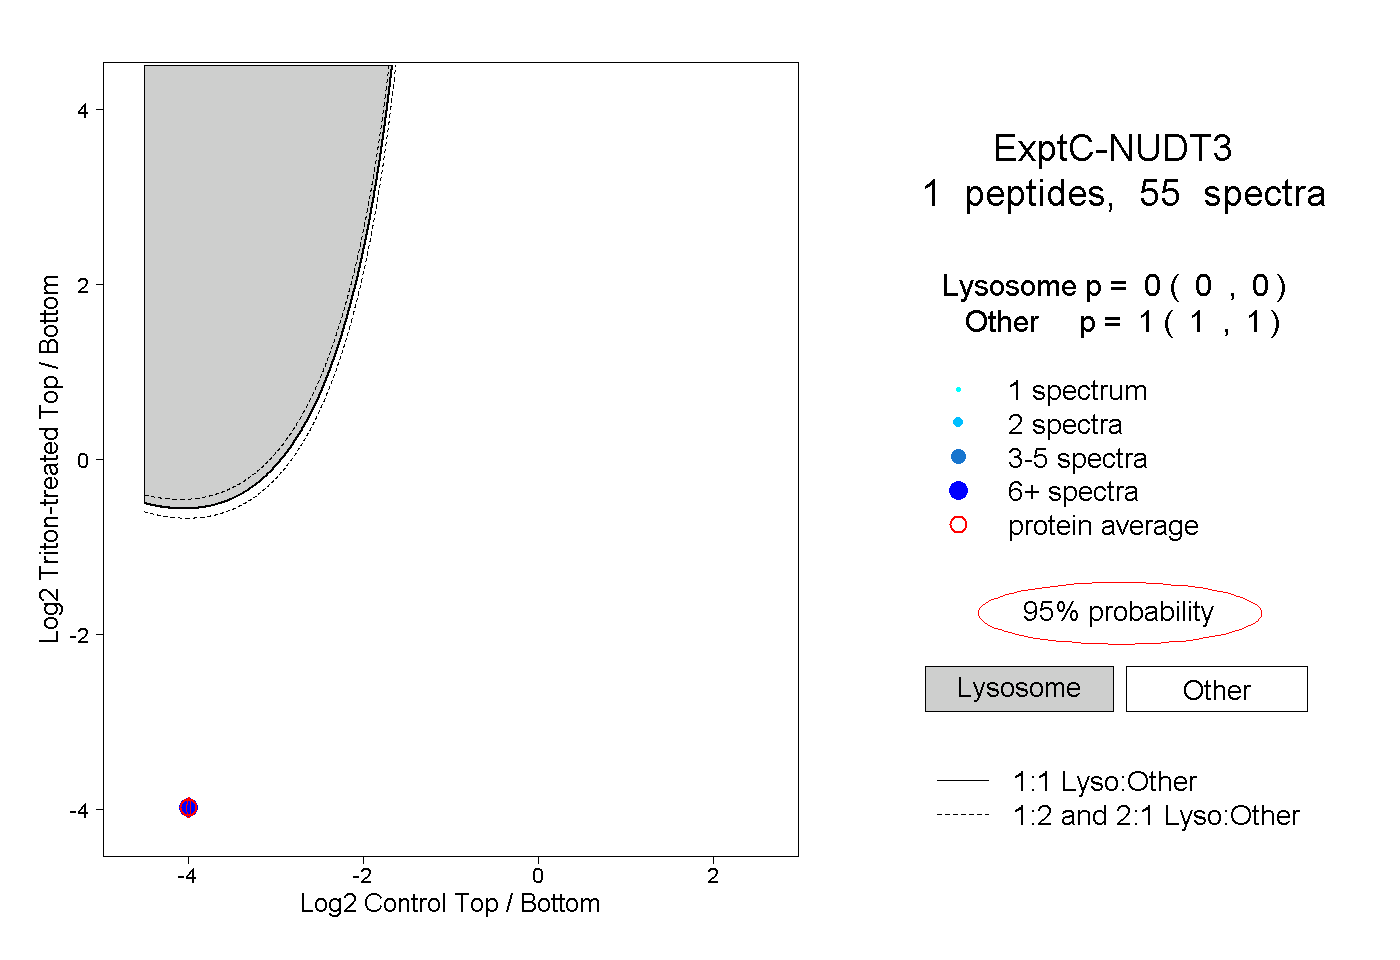
0.000 | 0.000
1.000 | 1.000