 4
4peptides
spectra
0.000 | 0.000
0.961 | 1.000
0.000 | 0.031
0.000 | 0.000
0.000 | 0.000
0.000 | 0.000
0.000 | 0.000
0.000 | 0.000
6peptides
spectra
0.001 | 0.981
0.019 | 0.999
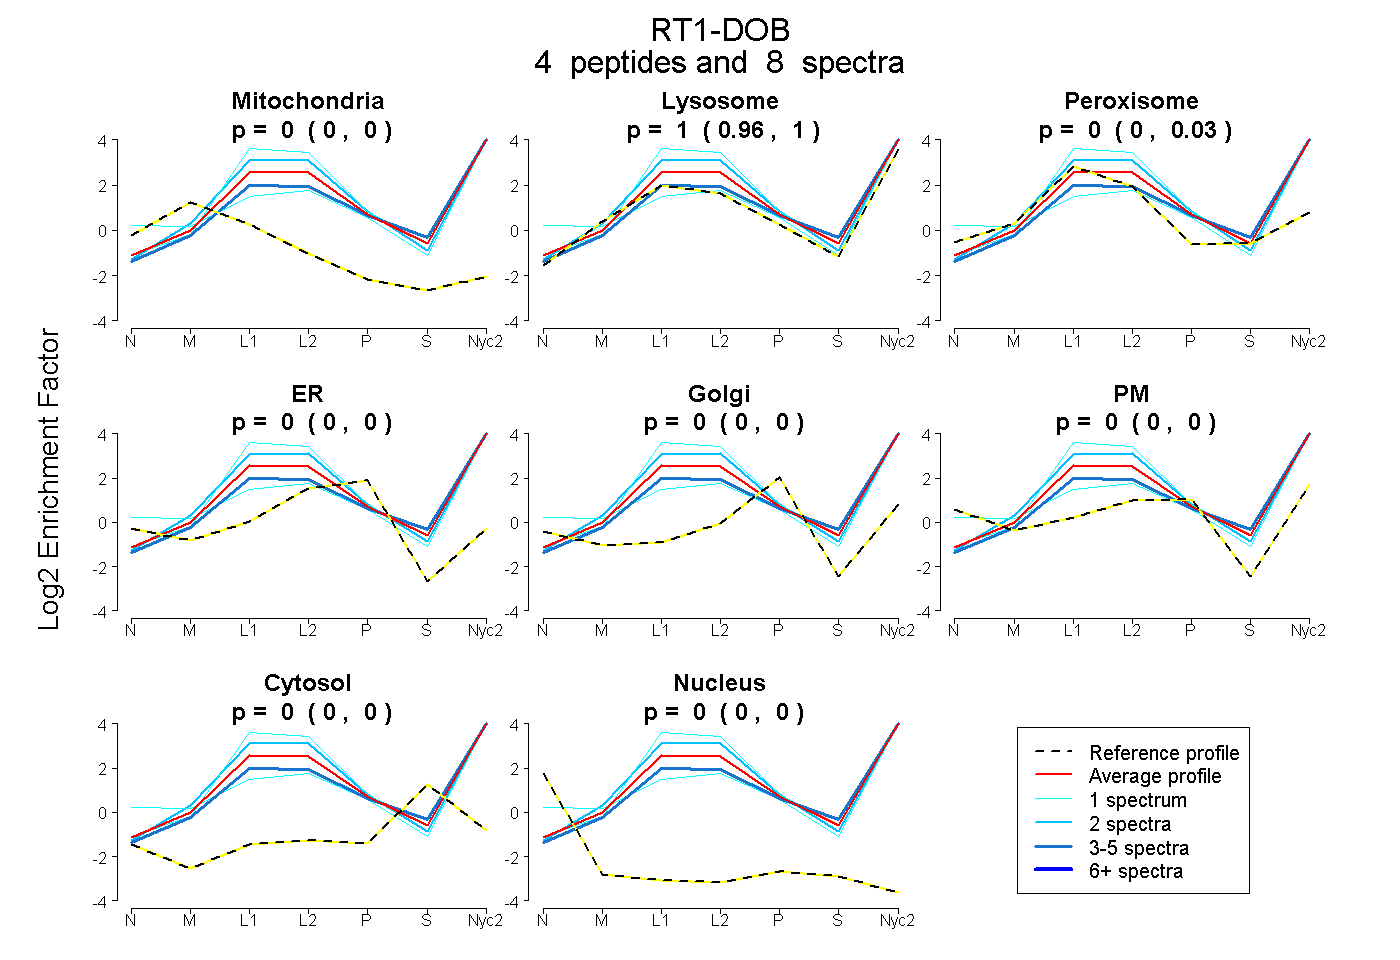
| Plot | Mito | Lyso | Perox | ER | Golgi | PM | Cytosol | Nucleus | |||||
| Expt A |
4 peptides |
8 spectra |
|
0.000 0.000 | 0.000 |
1.000 0.961 | 1.000 |
0.000 0.000 | 0.031 |
0.000 0.000 | 0.000 |
0.000 0.000 | 0.000 |
0.000 0.000 | 0.000 |
0.000 0.000 | 0.000 |
0.000 0.000 | 0.000 |
||
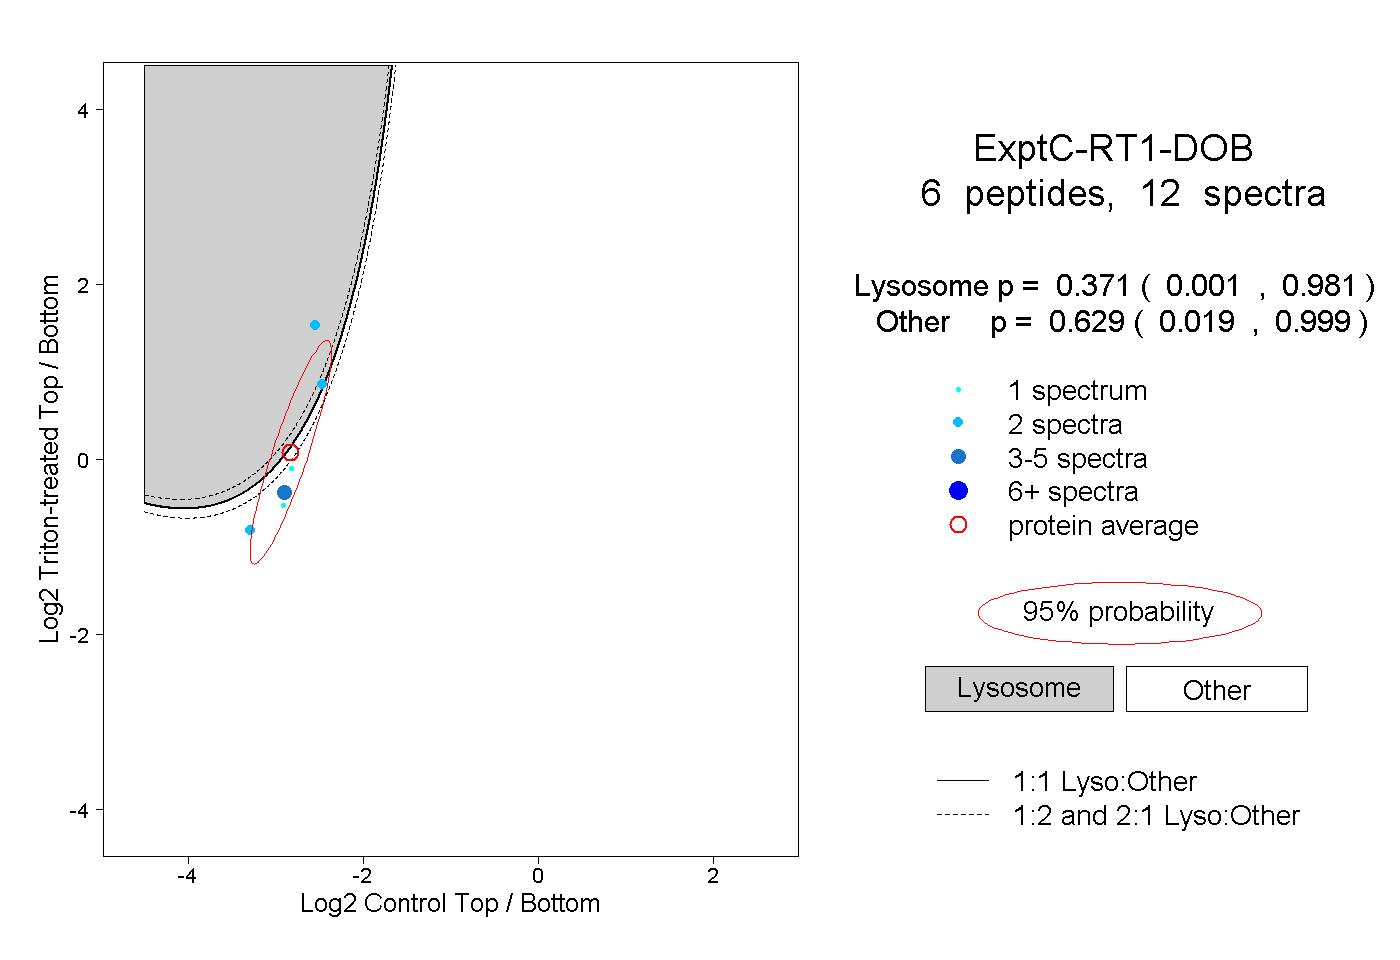
| Plot | Lyso | Other | |||||||||||
| Expt C |
6 peptides |
12 spectra |
|
0.371 0.001 | 0.981 |
0.629 0.019 | 0.999 |
| 4 spectra, NVPPEVTVYPER | 0.019 | 0.981 | ||||||||
| 2 spectra, LDLLETSR | 0.006 | 0.994 | ||||||||
| 2 spectra, LGAPFTVER | 0.583 | 0.417 | ||||||||
| 1 spectrum, SGVMSTGLVR | 0.005 | 0.995 | ||||||||
| 1 spectrum, AAVNMVCR | 0.097 | 0.903 | ||||||||
| 2 spectra, ASVETQPGNEASR | 0.999 | 0.001 |
| Plot | Lyso | Other | |||||||||||
| Expt D |
2 peptides |
4 spectra |
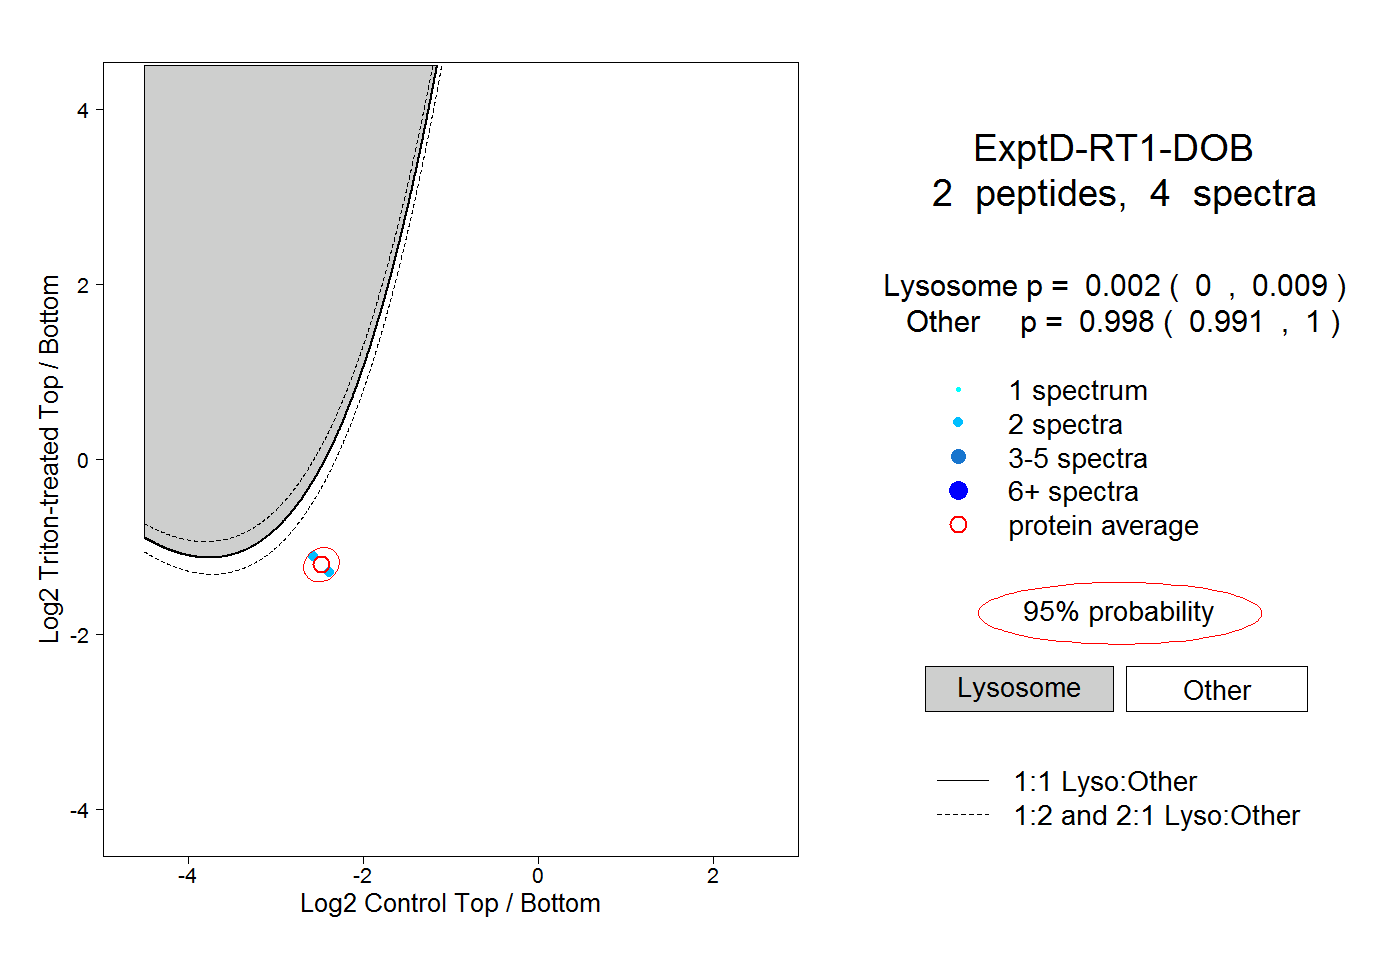 |
0.002 0.000 | 0.009 |
0.998 0.991 | 1.000 |