 4
4peptides
spectra
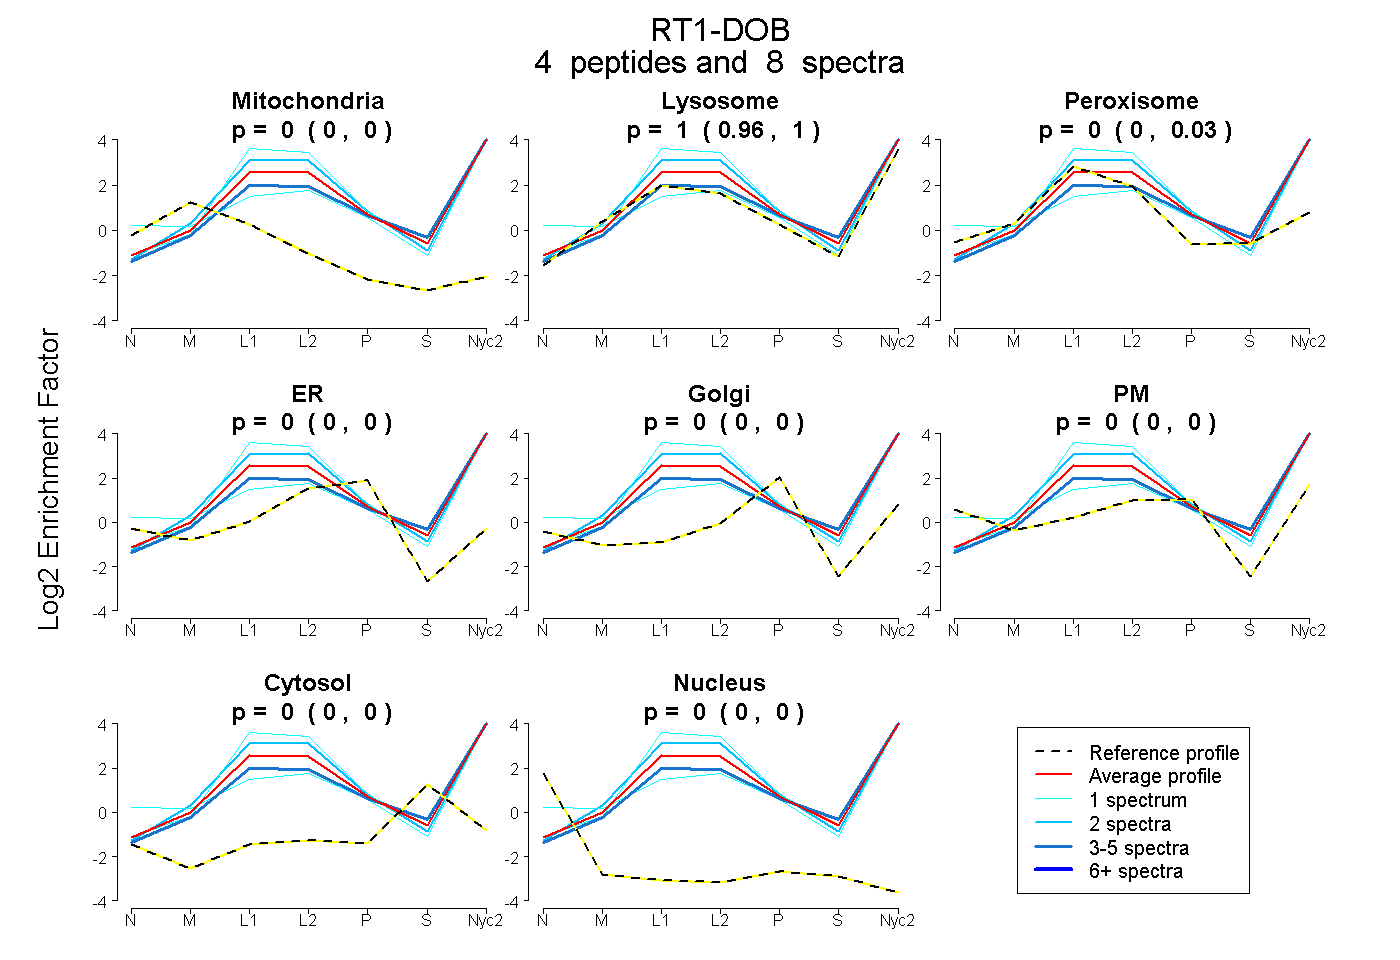
0.000 | 0.000
0.961 | 1.000
0.000 | 0.031
0.000 | 0.000
0.000 | 0.000
0.000 | 0.000
0.000 | 0.000
0.000 | 0.000
6peptides
spectra
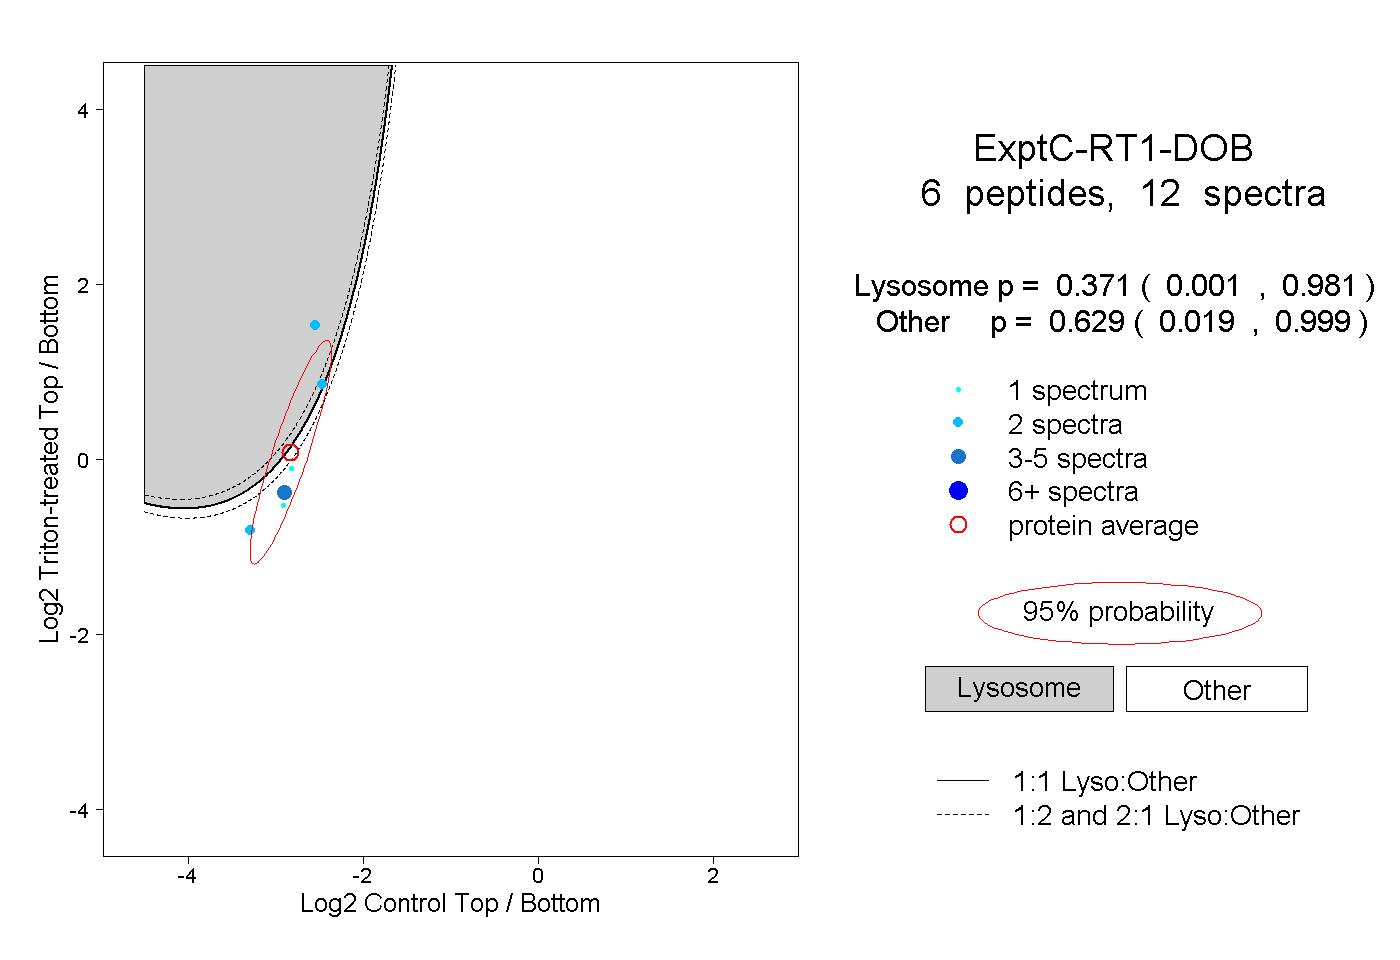
0.001 | 0.981
0.019 | 0.999
2peptides
spectra
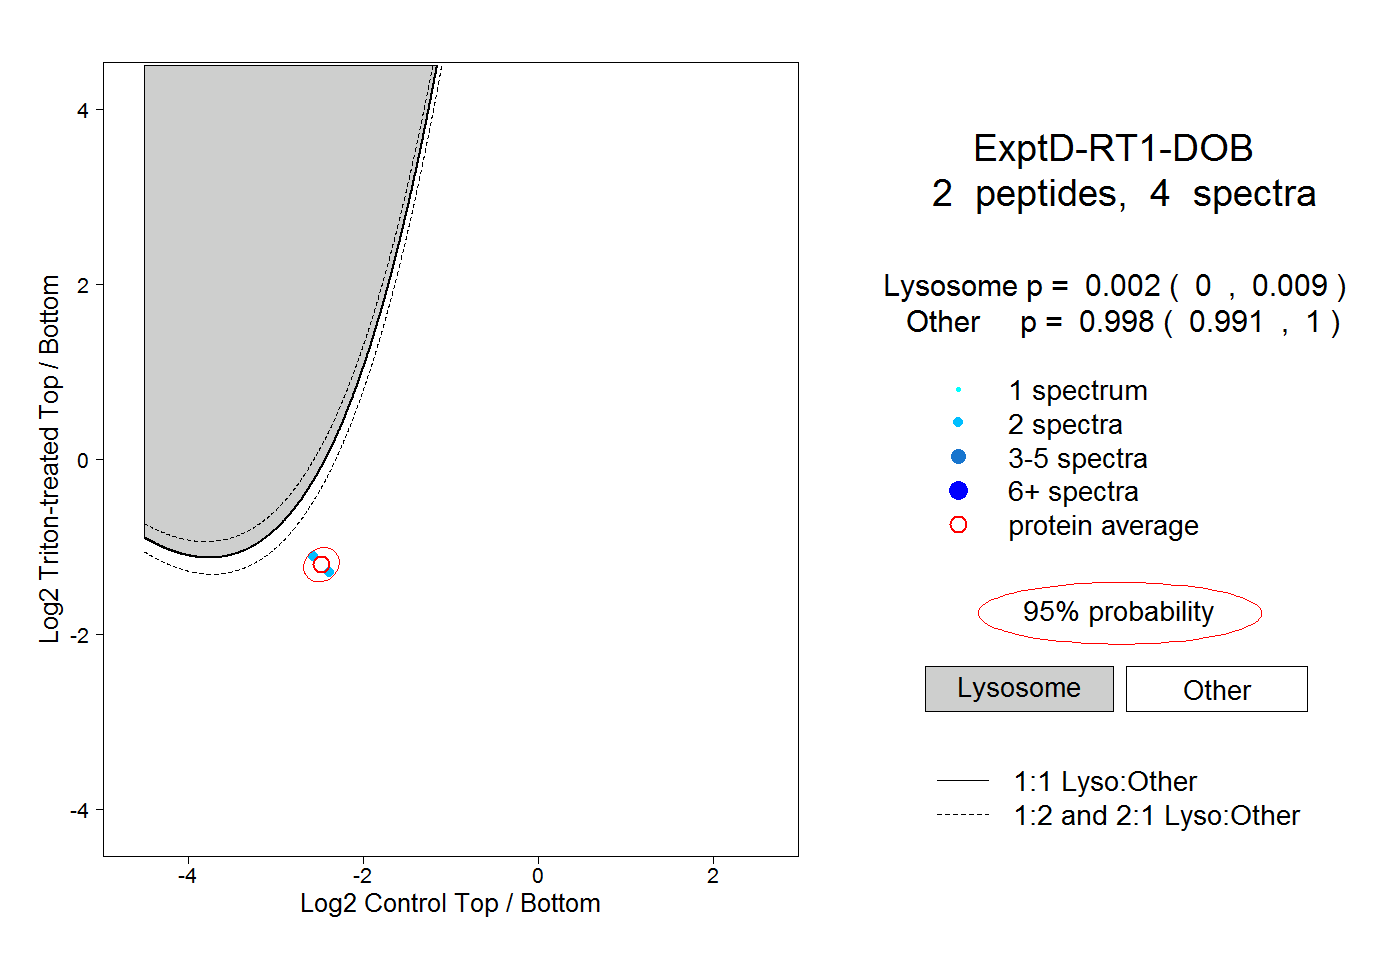
0.000 | 0.009
0.991 | 1.000